函数图象——在线性坐标系中绘制二次函数图象
本文记述了用 Matplotlib 在线性坐标系中绘制二次函数图象的例子。
代码主体内容如下:
...

def main():

    fig, axs = plt.subplots(1, 3, figsize=(14,4.5))             #1

    axs[0] = configure_axes(axs[0], 'Quadratic Function\t\t\t' + r'$\Delta > 0$', 18, 18, 10, 2, 10, 2)  #2
    x = np.linspace(-2.5,14.5,100)
    y = 1/3*x**2 - 4*x                                  #3
    axs[0].plot(x, y, color='b')
    axs[0].text(-4, 4,  r'$y = \frac{1}{3}x^2 - 4x$',  color='b', horizontalalignment='right',  verticalalignment='bottom')
                                                    #4

    axs[1] = configure_axes(axs[1], '\t\t\t\t\t\t\t' + r'$\Delta = 0$', 18, 18, 10, 2, 10, 2)   #2
    x = np.linspace(-5,11,100)
    y = -1/4*x**2 + 3/2*x - 9/4                         #3

    ...

    axs[2] = configure_axes(axs[2], '\t\t\t\t\t\t\t' + r'$\Delta < 0$', 18, 18, 10, 2, 10, 2)   #2
    x = np.linspace(-9.8,-2.2,100)
    y = x**2 + 12*x + 39                                #3

    ...

    fig.tight_layout()                  #5

    ...


def configure_axes(ax, title, xlimit, ylimit, xmajorunit = 5, xminorunit = 1, ymajorunit = 5, yminorunit = 1):

    ...


if __name__ == '__main__': main()

...
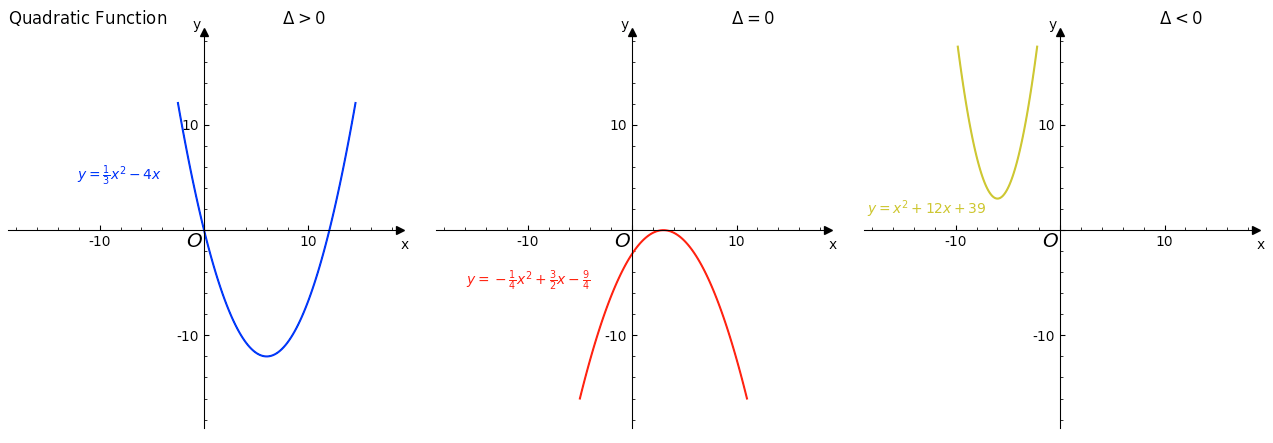
在绘图前,准备一个能放下 1x3 个图象的特定大小的区域(#1)。分别配置三个坐标系(#2),其中内容请参考在线性坐标系中绘制一次函数图象。绘图时,用蓝色、红色和黄色实线分别绘制 y = 1/3 * x^2 - 4*x 、y = -1/4 * x^2 + 3/2 * x - 9/4、 y = x^2 + 12 * x + 39 这三个二次函数图象(#3),并附上数学表达式说明(#4)。最后调整绘图区域大小以填充整个图象区域(#5)。
图象显示如下:

此代码可在 Matplotlib 3.3.4,Python 3.6.8 环境中运行。完整的代码请参考 [gitee] cnblogs/18439547 。
更多例子请参考 函数图象、数据可视化 和 Matplotlib Gallery。
受限于作者的水平,读者如发现有任何错误或有疑问之处,请追加评论或发邮件联系 green-pi@qq.com。作者将在收到意见后的第一时间里予以回复。 本文来自博客园,作者:green-cnblogs,转载请注明原文链接:https://www.cnblogs.com/green-cnblogs/p/18439547 谢谢!


 浙公网安备 33010602011771号