函数图象——在线性坐标系中绘制一次函数图象
本文记述了用 Matplotlib 在线性坐标系中绘制一次函数图象的例子。
代码主体内容如下:
...

def main():

    fig, ax = plt.subplots(figsize=(8,8))                   #1

    ax = configure_axes(ax, 'Linear Function', 10, 10)          #2

    x = np.linspace(-4, 4, 100)             #7
    y = 2 * x + 3/2
    ax.plot(x, y, color='b')

    x = np.linspace(-9, 9, 100)
    y = - 1/2 * x - 3
    ax.plot(x, y, color='r')

    ax.text(5, 9,  r'$y = 2x + \frac{3}{2}}$',  color='b', horizontalalignment='left',  verticalalignment='bottom')
    ax.text(9, -8, r'$y = -\frac{1}{2}x - 3}$', color='r', horizontalalignment='right', verticalalignment='top')
                                                                #8
    fig.tight_layout()                  #9

    ...


def configure_axes(ax, title, xlimit, ylimit, xmajorunit = 5, xminorunit = 1, ymajorunit = 5, yminorunit = 1):

    ax.set_title(title, fontsize='xx-large', loc='left')

    ax.spines['left'].set_position('zero')                      #3
    ax.spines['right'].set_visible(False)
    ax.spines['bottom'].set_position('zero')
    ax.spines['top'].set_visible(False)

    ax.text(-0.2, -0.2, 'O', fontsize='x-large', fontstyle='italic', horizontalalignment='right', verticalalignment='top')
                                                                            #4

    xlimit += xmajorunit*0.8                           #5
    ylimit += ymajorunit*0.8
    ax.set_xlim((-xlimit, xlimit))
    ax.set_ylim((-ylimit, ylimit))

    ax.plot(1, 0, '>k', transform=ax.get_yaxis_transform(), clip_on=False)              #6
    ax.xaxis.set_label_text('x')
    ax.xaxis.set_label_coords(1, 0.48)
    ax.xaxis.set_major_formatter(FuncFormatter(lambda w, pos: int(w) if w else ''))
    ax.xaxis.set_major_locator(MultipleLocator(xmajorunit))
    ax.xaxis.set_minor_locator(MultipleLocator(xminorunit))
    ax.xaxis.set_tick_params(which='both', direction='in')

    ax.plot(0, 1, '^k', transform=ax.get_xaxis_transform(), clip_on=False)
    ax.yaxis.set_label_text('y')

    ...


if __name__ == '__main__': main()

...
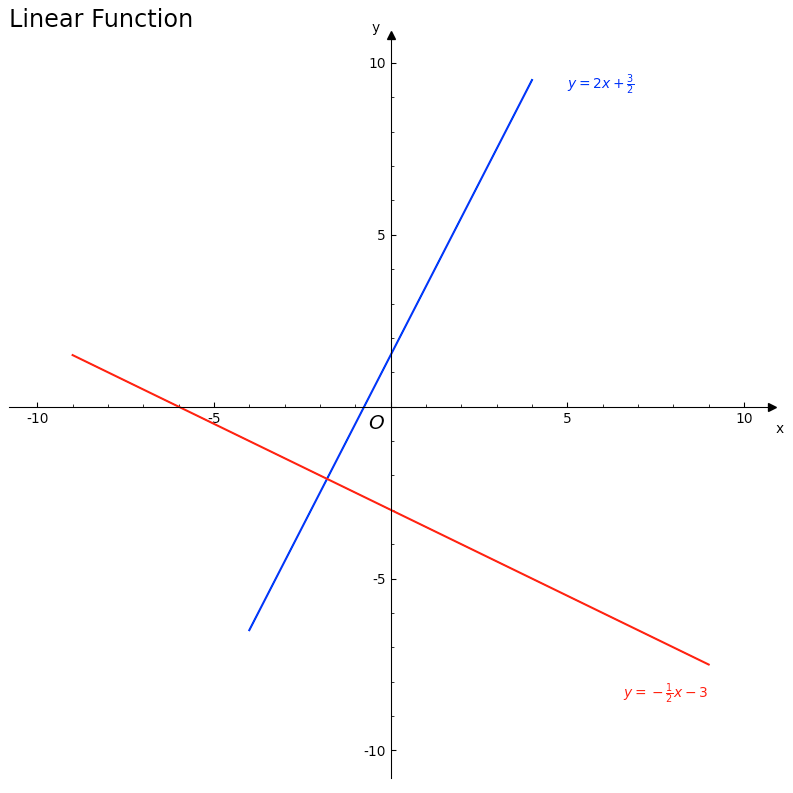
在绘图前,准备一个特定大小的区域(#1)。配置坐标系(#2),其中主要包括:;将坐标系轴置为原点位于图象中心的样式(#3);放置原点(#4);控制两个坐标轴的刻度范围边界(#5);设置 X 轴的坐标样式、名称、主次刻度值和位置(#6),Y 轴同样处理。绘图时,用蓝色和红色实线分别绘制 y = 2x + 3/2 和 y = -1/2x - 3 这两个一次函数图象(#7),并附上数学表达式说明(#8)。最后调整绘图区域大小以填充整个图象区域(#9)。
图象显示如下:

此代码可在 Matplotlib 3.3.4,Python 3.6.8 环境中运行。完整的代码请参考 [gitee] cnblogs/18435847 。
更多例子请参考 函数图象、数据可视化 和 Matplotlib Gallery。
受限于作者的水平,读者如发现有任何错误或有疑问之处,请追加评论或发邮件联系 green-pi@qq.com。作者将在收到意见后的第一时间里予以回复。 本文来自博客园,作者:green-cnblogs,转载请注明原文链接:https://www.cnblogs.com/green-cnblogs/p/18435847 谢谢!


【推荐】国内首个AI IDE,深度理解中文开发场景,立即下载体验Trae
【推荐】编程新体验,更懂你的AI,立即体验豆包MarsCode编程助手
【推荐】抖音旗下AI助手豆包,你的智能百科全书,全免费不限次数
【推荐】轻量又高性能的 SSH 工具 IShell:AI 加持,快人一步
· 分享一个免费、快速、无限量使用的满血 DeepSeek R1 模型,支持深度思考和联网搜索!
· 25岁的心里话
· 基于 Docker 搭建 FRP 内网穿透开源项目(很简单哒)
· ollama系列01:轻松3步本地部署deepseek,普通电脑可用
· 闲置电脑爆改个人服务器(超详细) #公网映射 #Vmware虚拟网络编辑器