JMeter3.2生成图形化HTML报告
JMeter3.0引入了Dashboard Report,用于生成HTML页面格式图形化报告的扩展模块。
该模块支持通过两种方式生成多维度图形化测试报告:
- 在JMeter性能测试结束时,自动生成本次测试的HTML图形化报告
- 使用一个已有的结果文件(如CSV文件)来生成对应结果的HTML图形化报告
但是3.0直接生成报告会出现乱码,建议下载3.1之后的版本,我这里下载的是最新的3.2。
如何生成报告?
从cmd进入执行测试文件,
- 基本命令格式:
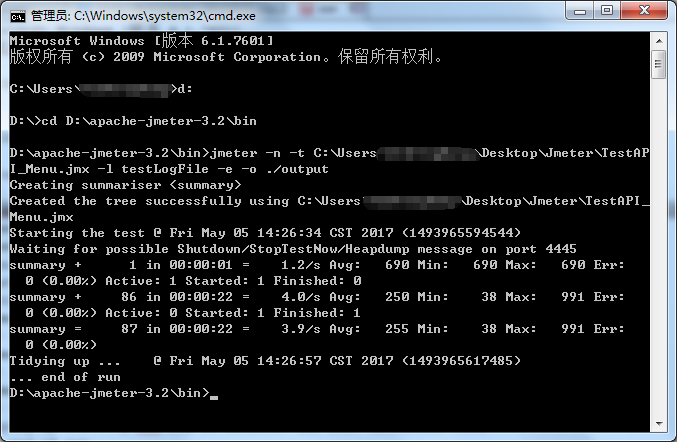
jmeter -n -t <test JMX file> -l <test log file> -e -o <Path to output folder>
- 示例:

执行完成后会在\apache-jmeter-3.2\bin\output目录下产生如下文件(夹):

打开index.html文件,就可以查看各种图形化报告:

如果需要从已有的结果文件CSV生成html报告,则需要配置jmeter.properties:
jmeter.save.saveservice.bytes = true
# Only available with HttpClient4
#jmeter.save.saveservice.sent_bytes=true
jmeter.save.saveservice.label = true
jmeter.save.saveservice.latency = true
jmeter.save.saveservice.response_code = true
jmeter.save.saveservice.response_message = true
jmeter.save.saveservice.successful = true
jmeter.save.saveservice.thread_counts = true
jmeter.save.saveservice.thread_name = true
jmeter.save.saveservice.time = true
jmeter.save.saveservice.connect_time = true
# the timestamp format must include the time and should include the date.
# For example the default, which is milliseconds since the epoch:
jmeter.save.saveservice.timestamp_format = ms
# Or the following would also be suitable
jmeter.save.saveservice.timestamp_format = yyyy/MM/dd HH:mm:ss
如果希望在Errors报告中展示更详细数据,需要确保如下配置
-
jmeter.save.saveservice.assertion_results_failure_message = true
- 如果使用了事务控制器(Transaction Controller),确认Generate parent sample为未勾选状态
使用已有的CSV日志文件生成报告
- 基本命令格式:
jmeter -g <log file> -o <Path to output folder>
- 示例:

更多资料,请查看官方Dashboard Report说明...
信用*创新*价值
作者:大道QA团队*大东哥
版权所有,转载请注明出处:http://www.cnblogs.com/greattao
作者:大道QA团队*大东哥
版权所有,转载请注明出处:http://www.cnblogs.com/greattao


