

Prometheus监控MySQL数据库
1、被管理主机服务器上安装mysql_export组件
下载地址:https://prometheus.io/download/

安装mysql_exporter
~]# tar xf mysqld_exporter-0.12.1.linux-amd64.tar.gz -C /usr/local/
~]# cd /usr/local/
local]#  ln -s mysqld_exporter-0.12.1.linux-amd64/ ./mysqld_exporter

创建一个数据库账号并授权,用于peometheus获取监控数据
mysql> create user 'mysql_exporter'@'localhost' identified by '123123';
Query OK, 0 rows affected (0.01 sec)

mysql> grant select,replication client,process on *.* to 'mysql_exporter'@'localhost';
Query OK, 0 rows affected (0.00 sec)
创建.my.cnf配置文件
~]# vim /usr/local/mysqld_exporter/.my.cnf
[client]
user=mysql_exporter
password=123123

启动mysql_exporter
mysqld_exporter]# ./mysqld_exporter --config.my-cnf=/usr/local/mysqld_exporter/.my.cnf &

mysqld_exporter]# ss -anpt |grep :9104
LISTEN     0      128       [::]:9104                  [::]:*                   users:(("mysqld_exporter",pid=2784,fd=3))
2、Prometheus服务器配置文件中添加被监控得MySQL配置段
增加配置段
prometheus]# vim prometheus.yml
  - job_name: 'mysql-client'
    static_configs:
    - targets: ['192.168.53.8:9104']

重启服务
prometheus]# pkill prometheus
prometheus]# ps -ef |grep prometheus |grep -v grep
prometheus]# ./prometheus --config.file=/usr/local/prometheus/prometheus.yml &
prometheus]# netstat -anpt |grep :9090
tcp        0      0 192.168.53.6:58602      192.168.53.6:9090       ESTABLISHED 1982/./prometheus
tcp6       0      0 :::9090                 :::*                    LISTEN      1982/./prometheus
tcp6       0      0 192.168.53.6:9090       192.168.53.6:58602      ESTABLISHED 1982/./prometheus
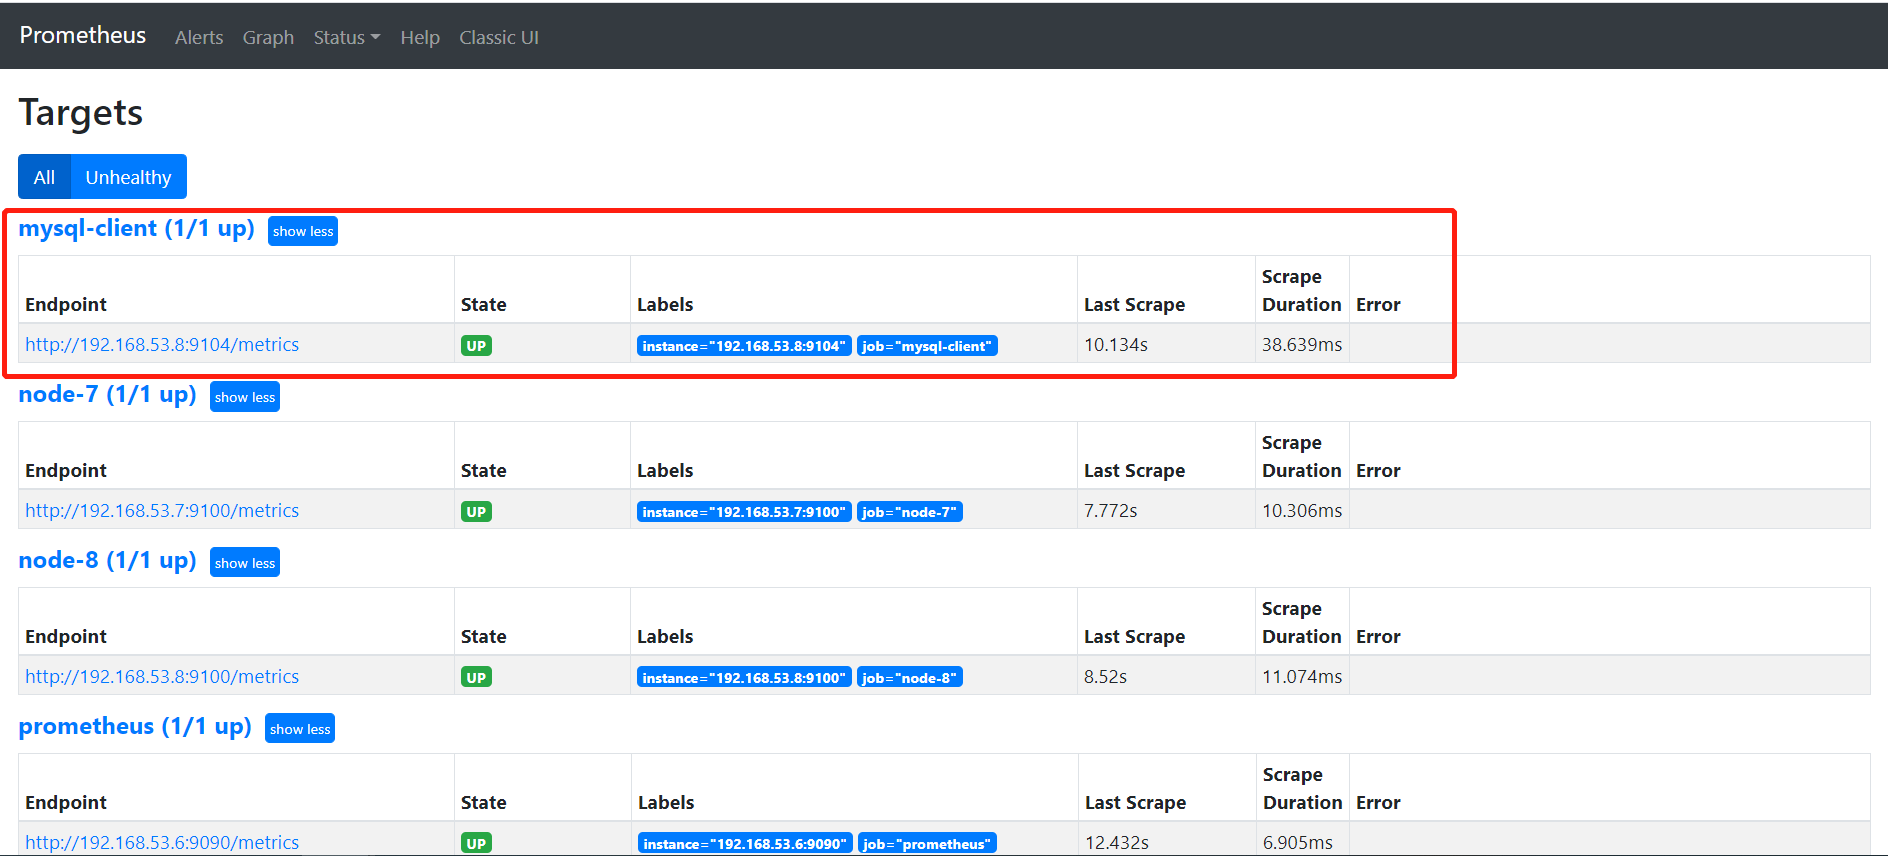
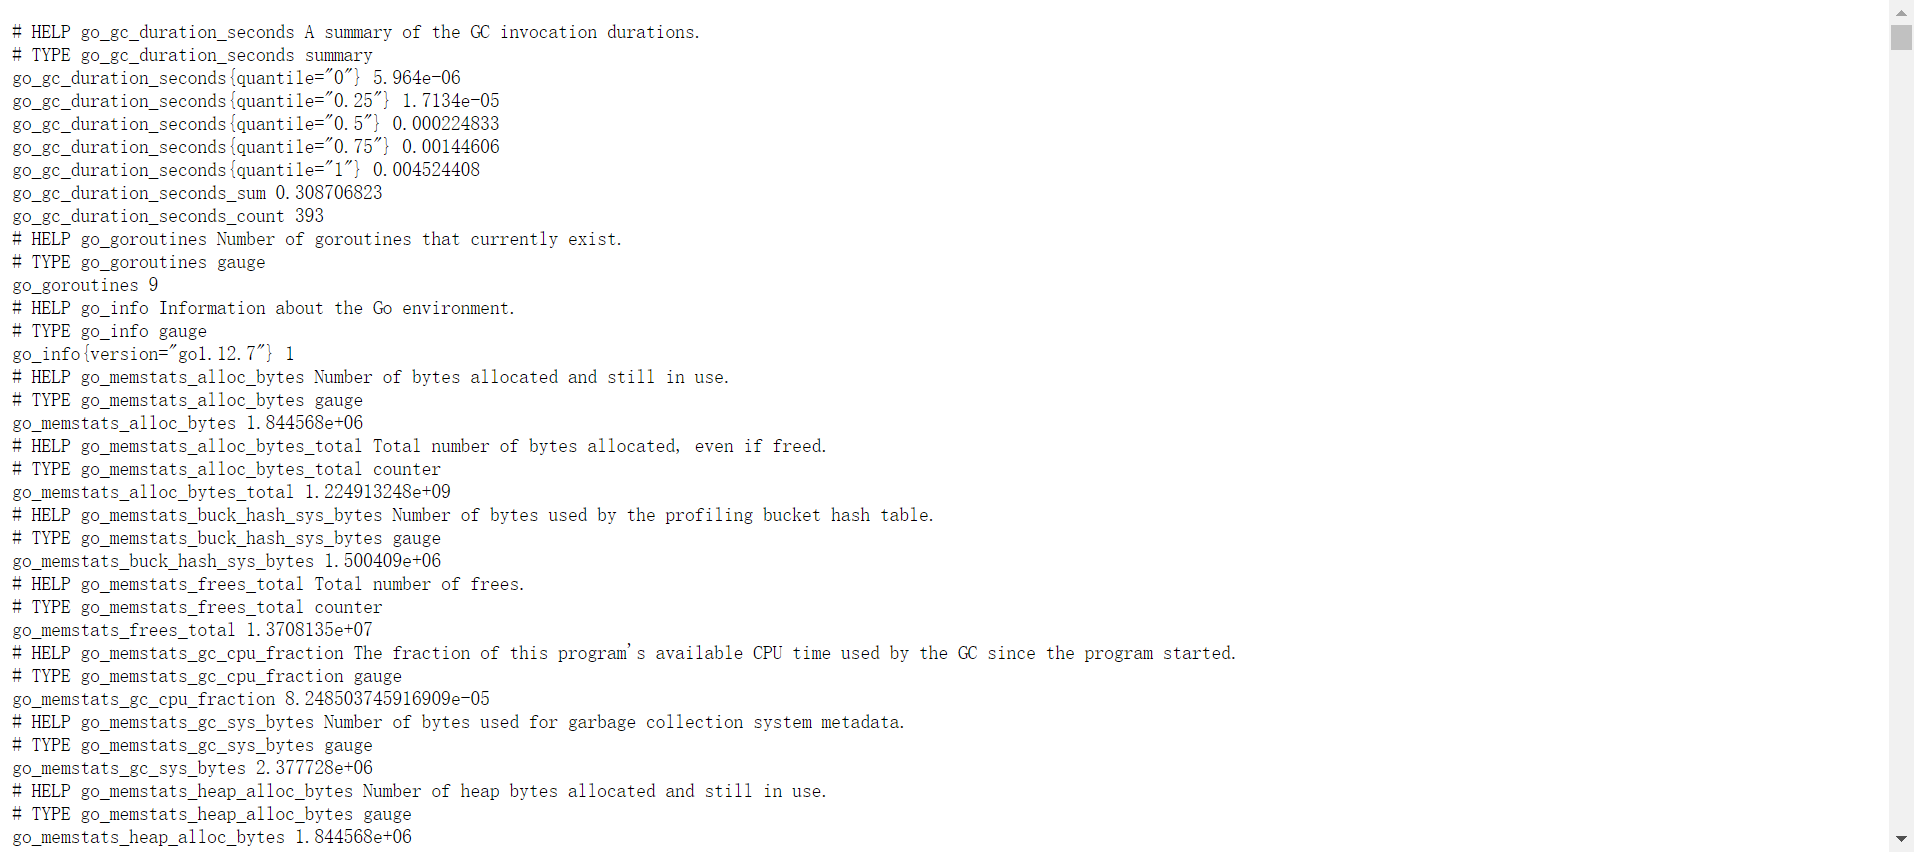
外部访问数据路径为:http://192.168.53.8:9104/metrics


【推荐】国内首个AI IDE,深度理解中文开发场景,立即下载体验Trae
【推荐】编程新体验,更懂你的AI,立即体验豆包MarsCode编程助手
【推荐】抖音旗下AI助手豆包,你的智能百科全书,全免费不限次数
【推荐】轻量又高性能的 SSH 工具 IShell:AI 加持,快人一步
· AI与.NET技术实操系列:基于图像分类模型对图像进行分类
· go语言实现终端里的倒计时
· 如何编写易于单元测试的代码
· 10年+ .NET Coder 心语,封装的思维:从隐藏、稳定开始理解其本质意义
· .NET Core 中如何实现缓存的预热?
· 25岁的心里话
· 闲置电脑爆改个人服务器(超详细) #公网映射 #Vmware虚拟网络编辑器
· 零经验选手,Compose 一天开发一款小游戏!
· 通过 API 将Deepseek响应流式内容输出到前端
· AI Agent开发,如何调用三方的API Function,是通过提示词来发起调用的吗