

Prometheus监控系统(一)安装
prometheus是一个用Go编写的时序数据库,可以支持多种语言客户端
安装步骤:
1)安装go 语言环境
2)在监控服务器上安装prometheus
3)被监控端安装 exporter
4)安装grafana
服务端安装:
1、go语言环境配置
下载地址:https://golang.google.cn/dl/
~]# wget https://storage.googleapis.com/golang/go1.8.3.linux-amd64.tar.gz
~]# tar xf go1.8.3.linux-amd64.tar.gz -C /usr/local/
~]# echo export PATH=$PATH:/usr/local/go/bin >>/etc/profile
~]# . /etc/profile
~]# go version
go version go1.8.3 linux/amd64
2、安装Prometheus
官网下载对应系统的版本:https://prometheus.io/download/
~]# wget https://github.com/prometheus/prometheus/releases/download/v2.25.0/prometheus-2.25.0.linux-amd64.tar.gz
~]# tar xf prometheus-2.25.0.linux-amd64.tar.gz -C /usr/local/
local]# ln -s prometheus-2.25.0.linux-amd64 prometheus
修改配置文件 prometheus.yml 如下图:

scrape_configs: 采集信息配置,一个job_name下也可配置多个targets
配置完之后后台运行,运行命令后加&就可以
# ./prometheus &
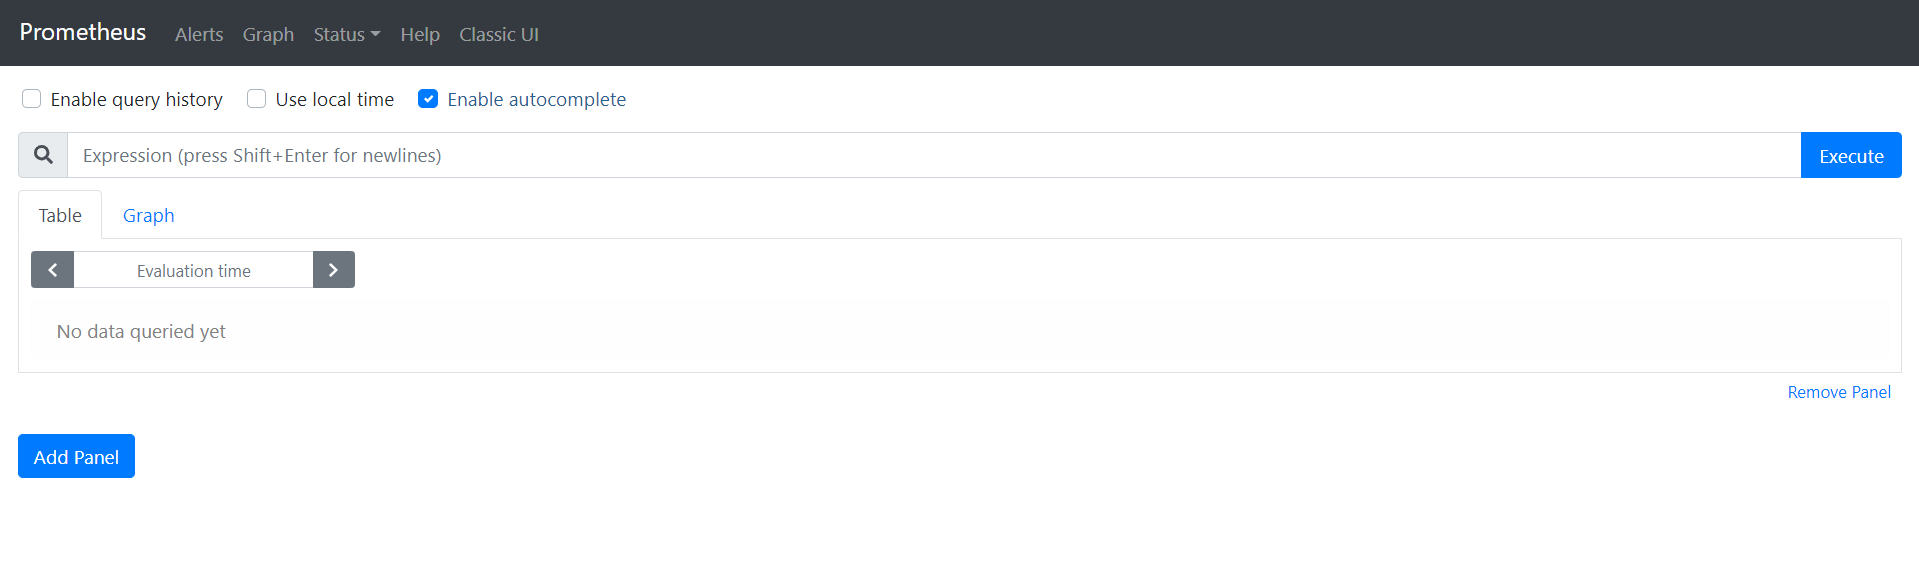
浏览器访问,默认监听9090端口
3、被监控端安装node_exporter(默认系统监控项),可以根据监控需求安装相对应得exporter
官网下载安装包:https://prometheus.io/download/
~]# tar xf node_exporter-1.1.2.linux-amd64.tar.gz -C /usr/local/
~]# /usr/local/node_exporter-1.1.2.linux-amd64/node_exporter &
~]# netstat -anpt |grep :9100
tcp6       0      0 :::9100                 :::*                    LISTEN      38922/node_exporter
tcp6       0      0 192.168.53.8:9100       192.168.53.6:56228      ESTABLISHED 38922/node_exporter

监控目标主机状态为UP
配置开机自启

]# vim /etc/systemd/system/prometheus.service

[Unit]
Description=Prometheus Monitoring System
Documentation=Prometheus Monitoring System

[Service]
ExecStart=/usr/local/prometheus/prometheus \
  --config.file=/usr/local/prometheus/prometheus.yml  \
  --web.listen-address=:9090

[Install]
WantedBy=multi-user.target

]# systemctl daemon-reload
]# systemctl start promethues
]# systemctl enable prometheus.service
Created symlink from /etc/systemd/system/multi-user.target.wants/prometheus.service to /etc/systemd/system/prometheus.service.
4、安装grafana,(下载地址:https://grafana.com/grafana/download?pg=graf&plcmt=deploy-box-1)默认得Prometheus页面没有那么直观,安装grafana是为了页面显示更加直观
~]# wget https://s3-us-west-2.amazonaws.com/grafana-releases/release/grafana-5.2.3-1.x86_64.rpm
~]# yum localinstall grafana-5.2.3-1.x86_64.rpm
~]# systemctl start grafana-server.service
~]# netstat -anpt |grep :3000
tcp6       0      0 :::3000                 :::*                    LISTEN      7509/grafana-server
浏览器访问grafana 默认端口 3000

输入默认账号密码 admin/admin,而后提示更新密码
添加Data Sources,新增

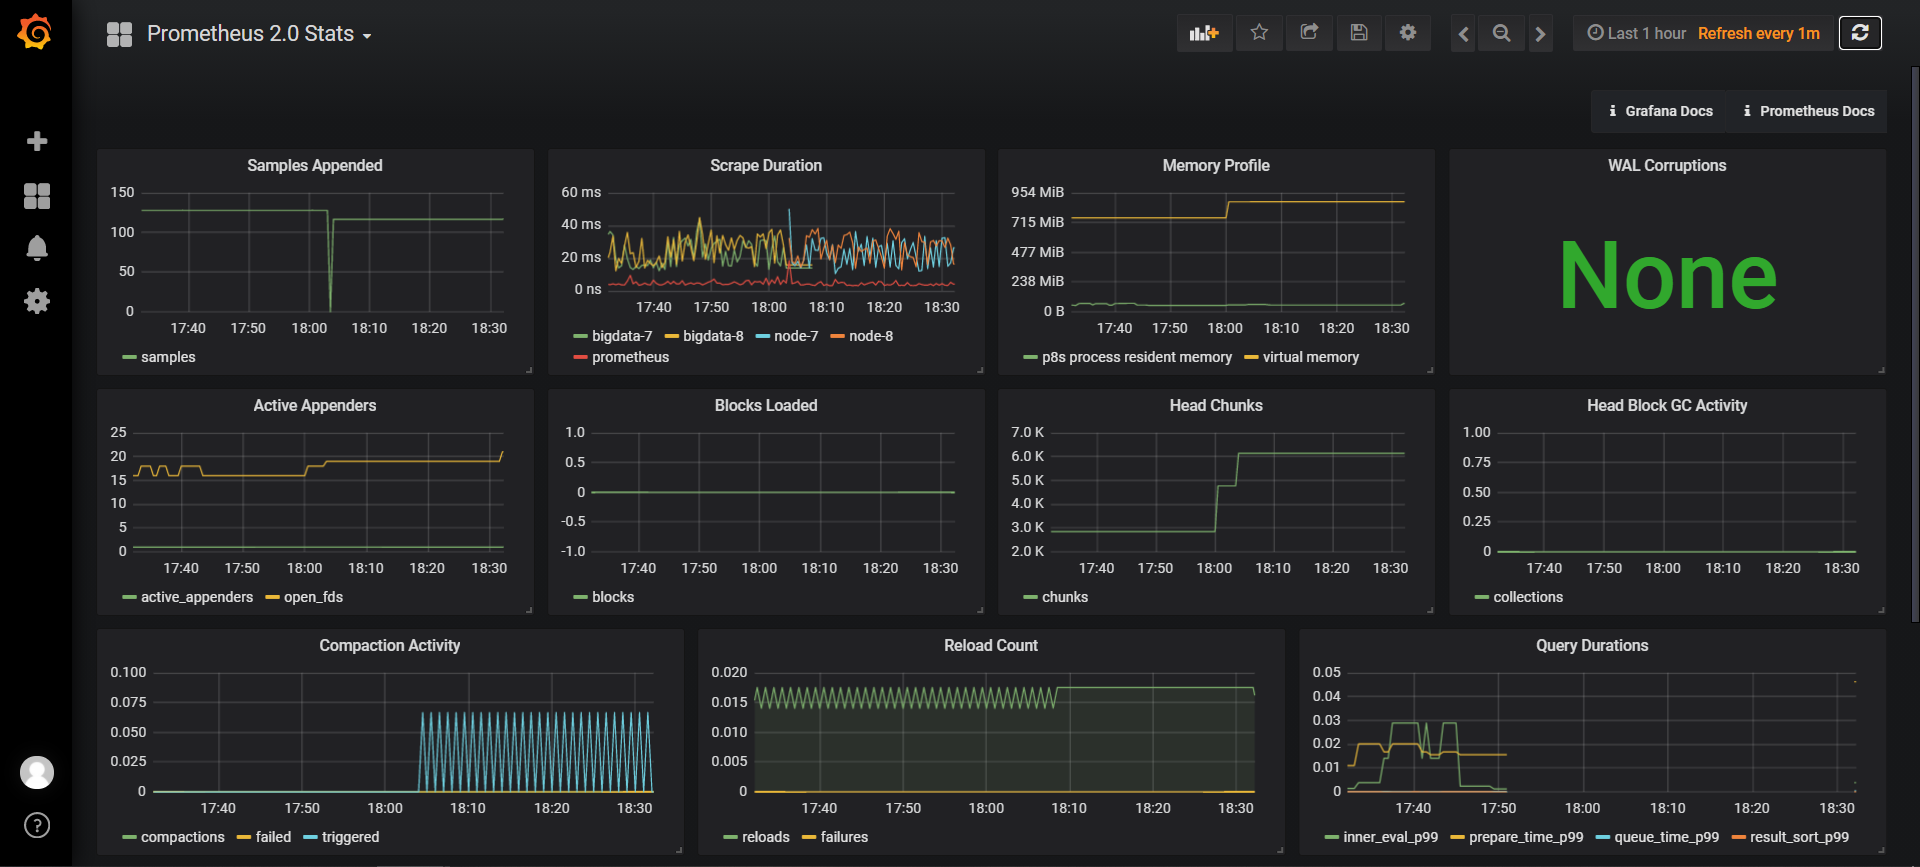
选择Prometheus 2.0 Stats,保存
最终效果如下:
标签:
Prometheus


【推荐】国内首个AI IDE,深度理解中文开发场景,立即下载体验Trae
【推荐】编程新体验,更懂你的AI,立即体验豆包MarsCode编程助手
【推荐】抖音旗下AI助手豆包,你的智能百科全书,全免费不限次数
【推荐】轻量又高性能的 SSH 工具 IShell:AI 加持,快人一步
· AI与.NET技术实操系列:基于图像分类模型对图像进行分类
· go语言实现终端里的倒计时
· 如何编写易于单元测试的代码
· 10年+ .NET Coder 心语,封装的思维:从隐藏、稳定开始理解其本质意义
· .NET Core 中如何实现缓存的预热?
· 25岁的心里话
· 闲置电脑爆改个人服务器(超详细) #公网映射 #Vmware虚拟网络编辑器
· 零经验选手,Compose 一天开发一款小游戏!
· 通过 API 将Deepseek响应流式内容输出到前端
· AI Agent开发,如何调用三方的API Function,是通过提示词来发起调用的吗