
nagios部署
nagios的服务端部署
1、配置yum源,配置成阿里的yum源
cd  /etc/yum.repos.d/
wget -O /etc/yum.repos.d/CentOS-Base.repo http://mirrors.aliyun.com/repo/Centos-6.repo
2、配置环境变量
echo  "export LC_ALL=C">>/etc/profile
source /etc/profile
3、停掉iptables selinux
/etc/init.d/iptables  stop
chkconfig  iptables off

setenforce 0
cat  /etc/selinux/config
SELINUX=disabled
4、配置时间同步的定时任务
[root@nagios-srv nrpe-2.12]# crontab -l
#######################
*/5 * * * *  /usr/sbin/ntpdate time.nist.gov >/dev/null 2>&1
5、安装nagios服务支持包
yum install gcc glibc glibc-common gd gd-devel httpd php php-gd mysql* -y
6、添加nagios用户和组
useradd -m nagios
#useradd  apache  #yum安装httpd,不需要再创建apache用户,yum时会生成
groupadd nagcmd
usermod -a -G nagcmd nagios
usermod -a -G nagcmd apache
7、下载和安装nagios
cd  /home/oldboy/tools/
tar  xf nagios-3.5.1.tar.gz
cd nagios
./configure --with-command-group=nagcmd
make all
make install
make install-init
make install-config
make install-commandmode
make install-webconf
8、添加web认证
由于在 make install-config的时候生成nagios配置文件为/etc/httpd/conf.d/nagios.conf,此配置文件指定的web认证文件为/usr/local/nagios/etc/htpasswd.users,所以要在这里添加web认证,查看nagios配置文件如下:
[root@nagios-srv nrpe-2.12]# cat /etc/httpd/conf.d/nagios.conf
<Directory "/usr/local/nagios/share">
#  SSLRequireSSL
   Options None
   AllowOverride None
   Order allow,deny
   Allow from all
#  Order deny,allow
#  Deny from all
#  Allow from 127.0.0.1
   AuthName "Nagios Access"
   AuthType Basic
   AuthUserFile /usr/local/nagios/etc/htpasswd.users
   Require valid-user
</Directory>
所以添加web认证为:
htpasswd -cb /usr/local/nagios/etc/htpasswd.users oldboy 123456
9、安装nagios插件 nagios-plugins
yum -y install perl-devel
tar  xf nagios-plugins-1.4.16.tar.gz
cd nagios-plugins-1.4.16
./configure --with-nagios-user=nagios --with-nagios-group=nagios --enable-perl-modules
make && make install
安装完nagios插件后,可以查看到底安装了多少插件:ls /usr/local//nagios/libexec/|wc -l


[root@nagios-srv nrpe-2.12]# ll /usr/local//nagios/libexec/
total 5748
-rwxr-xr-x 1 nagios nagios 376556 Oct 12 22:33 check_apt
-rwxr-xr-x 1 nagios nagios   2245 Oct 12 22:33 check_breeze
-rwxr-xr-x 1 nagios nagios 128328 Oct 12 22:33 check_by_ssh
lrwxrwxrwx 1 root   root        9 Oct 12 22:33 check_clamd -> check_tcp
-rwxr-xr-x 1 nagios nagios  85726 Oct 12 22:33 check_cluster
-r-sr-xr-x 1 root   nagios 123643 Oct 12 22:33 check_dhcp
-rwxr-xr-x 1 nagios nagios 121650 Oct 12 22:33 check_dig
-rwxr-xr-x 1 nagios nagios 417927 Oct 12 22:33 check_disk
-rwxr-xr-x 1 nagios nagios   9148 Oct 12 22:33 check_disk_smb
-rwxr-xr-x 1 nagios nagios 129515 Oct 12 22:33 check_dns
-rwxr-xr-x 1 nagios nagios  80721 Oct 12 22:33 check_dummy
-rwxr-xr-x 1 nagios nagios   3056 Oct 12 22:33 check_file_age
-rwxr-xr-x 1 nagios nagios   6318 Oct 12 22:33 check_flexlm
lrwxrwxrwx 1 root   root        9 Oct 12 22:33 check_ftp -> check_tcp
-rwxr-xr-x 1 nagios nagios 520646 Oct 12 22:33 check_http
-r-sr-xr-x 1 root   nagios 133729 Oct 12 22:33 check_icmp
-rwxr-xr-x 1 nagios nagios  93440 Oct 12 22:33 check_ide_smart
-rwxr-xr-x 1 nagios nagios  15137 Oct 12 22:33 check_ifoperstatus
-rwxr-xr-x 1 nagios nagios  12601 Oct 12 22:33 check_ifstatus
lrwxrwxrwx 1 root   root        9 Oct 12 22:33 check_imap -> check_tcp
-rwxr-xr-x 1 nagios nagios   6890 Oct 12 22:33 check_ircd
lrwxrwxrwx 1 root   root        9 Oct 12 22:33 check_jabber -> check_tcp
-rwxr-xr-x 1 nagios nagios 106605 Oct 12 22:33 check_load
-rwxr-xr-x 1 nagios nagios   6020 Oct 12 22:33 check_log
-rwxr-xr-x 1 nagios nagios  20287 Oct 12 22:33 check_mailq
-rwxr-xr-x 1 nagios nagios  93174 Oct 12 22:33 check_mrtg
-rwxr-xr-x 1 nagios nagios  92511 Oct 12 22:33 check_mrtgtraf
-rwxr-xr-x 1 nagios nagios 129444 Oct 12 22:33 check_mysql
-rwxr-xr-x 1 nagios nagios 122426 Oct 12 22:33 check_mysql_query
-rwxr-xr-x 1 nagios nagios 105638 Oct 12 22:33 check_nagios
lrwxrwxrwx 1 root   root        9 Oct 12 22:33 check_nntp -> check_tcp
lrwxrwxrwx 1 root   root        9 Oct 12 22:33 check_nntps -> check_tcp
-rwxrwxr-x 1 nagios nagios  76752 Oct 12 22:40 check_nrpe
-rwxr-xr-x 1 nagios nagios 127711 Oct 12 22:33 check_nt
-rwxr-xr-x 1 nagios nagios 130102 Oct 12 22:33 check_ntp
-rwxr-xr-x 1 nagios nagios 119191 Oct 12 22:33 check_ntp_peer
-rwxr-xr-x 1 nagios nagios 117760 Oct 12 22:33 check_ntp_time
-rwxr-xr-x 1 nagios nagios 159404 Oct 12 22:33 check_nwstat
-rwxr-xr-x 1 nagios nagios   8324 Oct 12 22:33 check_oracle
-rwxr-xr-x 1 nagios nagios 108966 Oct 12 22:33 check_overcr
-rwxr-xr-x 1 nagios nagios 132723 Oct 12 22:33 check_ping
lrwxrwxrwx 1 root   root        9 Oct 12 22:33 check_pop -> check_tcp
-rwxr-xr-x 1 nagios nagios 396865 Oct 12 22:33 check_procs
-rwxr-xr-x 1 nagios nagios 106524 Oct 12 22:33 check_real
-rwxr-xr-x 1 nagios nagios   9584 Oct 12 22:33 check_rpc
-rwxr-xr-x 1 nagios nagios   1412 Oct 12 22:33 check_sensors
lrwxrwxrwx 1 root   root        9 Oct 12 22:33 check_simap -> check_tcp
-rwxr-xr-x 1 nagios nagios 446535 Oct 12 22:33 check_smtp
lrwxrwxrwx 1 root   root        9 Oct 12 22:33 check_spop -> check_tcp
-rwxr-xr-x 1 nagios nagios 103032 Oct 12 22:33 check_ssh
lrwxrwxrwx 1 root   root        9 Oct 12 22:33 check_ssmtp -> check_tcp
-rwxr-xr-x 1 nagios nagios 108265 Oct 12 22:33 check_swap
-rwxr-xr-x 1 nagios nagios 160418 Oct 12 22:33 check_tcp
-rwxr-xr-x 1 nagios nagios 105054 Oct 12 22:33 check_time
lrwxrwxrwx 1 root   root        9 Oct 12 22:33 check_udp -> check_tcp
-rwxr-xr-x 1 nagios nagios 117566 Oct 12 22:33 check_ups
-rwxr-xr-x 1 nagios nagios  83458 Oct 12 22:33 check_users
-rwxr-xr-x 1 nagios nagios   2939 Oct 12 22:33 check_wave
-rwxr-xr-x 1 nagios nagios 109747 Oct 12 22:33 negate
-rwxr-xr-x 1 nagios nagios 103274 Oct 12 22:33 urlize
-rwxr-xr-x 1 nagios nagios   1921 Oct 12 22:33 utils.pm
-rwxr-xr-x 1 nagios nagios   2728 Oct 12 22:33 utils.sh
10、安装nrpe
因为只有安装了nrpe,服务端才有check_nrpe插件,才可和nrpe客户端通讯,而且服务端也要被监控,所以这个nrpe插件一定要安装
tar xf  nrpe-2.12.tar.gz
cd nrpe-2.12
./configure
make all
make install-plugin
make install-daemon
make install-daemon-config
11、启动nagios和apache,查看nagios和apache服务是否启动
/etc/init.d/nagios start
/etc/init.d/httpd  start
[root@nagios-srv nrpe-2.12]# ps  -ef|grep nagios
nagios    54358      1  0 22:43 ?        00:00:01 /usr/local/nagios/bin/nagios -d /usr/local/nagios/etc/nagios.cfg

[root@nagios-srv nrpe-2.12]# lsof -i :80
COMMAND   PID   USER   FD   TYPE DEVICE SIZE/OFF NODE NAME
httpd   54457   root    4u  IPv6 108352      0t0  TCP *:http (LISTEN)
httpd   54459 apache    4u  IPv6 108352      0t0  TCP *:http (LISTEN)
httpd   54460 apache    4u  IPv6 108352      0t0  TCP *:http (LISTEN)
httpd   54461 apache    4u  IPv6 108352      0t0  TCP *:http (LISTEN)
httpd   54462 apache    4u  IPv6 108352      0t0  TCP *:http (LISTEN)
httpd   54463 apache    4u  IPv6 108352      0t0  TCP *:http (LISTEN)
httpd   54464 apache    4u  IPv6 108352      0t0  TCP *:http (LISTEN)
httpd   54465 apache    4u  IPv6 108352      0t0  TCP *:http (LISTEN)
httpd   54466 apache    4u  IPv6 108352      0t0  TCP *:http (LISTEN)
httpd   54467 apache    4u  IPv6 108352      0t0  TCP *:http (LISTEN)
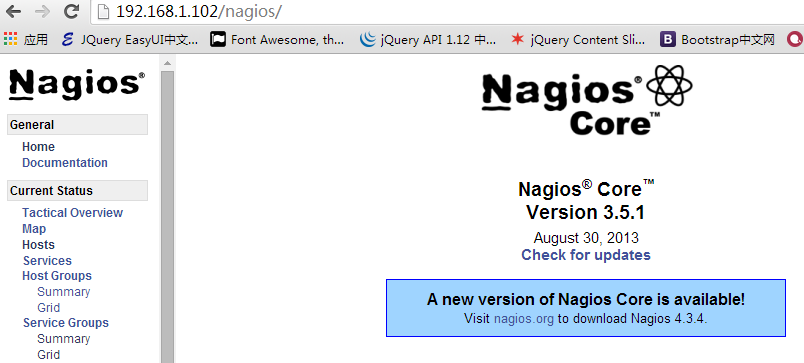
12、最后通过浏览器访问nagios查看nagios服务端是否部署成功
访问http://192.168.1.102/nagios/ 提示输入认证的用户名和密码:
通过输入正确的用户名和密码后界面如下就表示nagios服务端部署完成了
nagios客户端部署
由于客户端不需要画图工具和lamp环境,所以在安装nagios需要的支持包客户端就没必要装了(比如:gd gd-devel httpd php php-gd mysql* -y不需要安装)
但是还是要检查selinux、iptables要关掉,更换成阿里云的yum源,配置环境变量、还有时间同步定时任务要部署。
1、创建nagios用户
[root@lnmp01 tools]# useradd nagios -m -s /sbin/nologin
2、安装nagios-pluins插件
yum  install  perl-devel -y

tar xf  nagios-plugins-1.4.16.tar.gz
cd  nagios-plugins-1.4.16
./configure --prefix=/usr/local/nagios --enable-perl-modules --enable-redhat-pthread-workaround
make  && make install
最后统计安装了多少nagios插件:ll /usr/local/nagios/libexec/|wc -l
3、安装nrpe
tar xf  nrpe-2.12.tar.gz
cd nrpe-2.12
./configure
make all
make install-plugin
make install-daemon
make install-daemon-config
4、安装监控磁盘IO的iostat所需要的软件
Class-Accessor-0.31.tar.gz
Config-Tiny-2.12.tar.gz
Math-Calc-Units-1.07.tar.gz
Nagios-Plugin-0.34.tar.gz
Params-Validate-0.91.tar.gz
Regexp-Common-2010010201.tar.gz
安装这些软件:
tar  xf  Params-Validate-0.91.tar.gz
cd  Params-Validate-0.91
perl Makefile.PL
make && make install
cd ..

tar xf  Class-Accessor-0.31.tar.gz
cd  Class-Accessor-0.31
perl  Makefile.PL
make  && make install
cd ..

tar  xf  Math-Calc-Units-1.07.tar.gz
cd  Math-Calc-Units-1.07
perl  Makefile.PL
make  && make install
cd ..

tar xf  Regexp-Common-2010010201.tar.gz
cd Regexp-Common-2010010201
perl  Makefile.PL
make && make  install
cd ..

tar xf  Nagios-Plugin-0.34.tar.gz
cd  Nagios-Plugin-0.34
perl  Makefile.PL
make && make install
cd ..

tar xf  Config-Tiny-2.12.tar.gz
cd  Config-Tiny-2.12
perl  Makefile.PL
make  && make install
cd..
5、安装sysstat
[root@lnmp01 tools]# yum install sysstat -y
6、调整check_memory.pl、check_iostat插件
cp  /home/oldboy/tools/check_memory.pl /usr/local/nagios/libexec/
cp  /home/oldboy/tools/check_iostat /usr/local/nagios/libexec/
chmod 755 /usr/local/nagios/libexec/check_memory.pl
chmod 755 /usr/local/nagios/libexec/check_iostat
dos2unix  /usr/local/nagios/libexec/check_memory.pl
dos2unix  /usr/local/nagios/libexec/check_iostat
7、修改nrpe配置文件
修改nrpe.cfg,允许那台主机可以监控管理本机,将nagios的服务端的ip加进来
[root@lnmp01 tools]# vim  /usr/local/nagios/etc/nrpe.cfg

allowed_hosts=127.0.0.1,192.168.1.102
同时对配置文件中的下面5行数据删除
199 command[check_users]=/usr/local/nagios/libexec/check_users -w 5 -c 10
200 command[check_load]=/usr/local/nagios/libexec/check_load -w 15,10,5 -c 30,25
    ,20
201 command[check_hda1]=/usr/local/nagios/libexec/check_disk -w 20% -c 10% -p /d
    ev/hda1
202 command[check_zombie_procs]=/usr/local/nagios/libexec/check_procs -w 5 -c 10
     -s Z
203 command[check_total_procs]=/usr/local/nagios/libexec/check_procs -w 150 -c 2
    00
删除上面的5行数据后再加入使用下面的命令导入到nrpe.cfg的配置文件中
如果后期自己写的插件,就应该放在这个配置文件的指定位置中,并在此配置文件中配置。
echo "command[check_load]=/usr/local/nagios/libexec/check_load -w 15,10,6 -c 30,25,20">>/usr/local/nagios/etc/nrpe.cfg
echo "command[check_mem]=/usr/local/nagios/libexec/check_memory.pl -w 6% -c 3%">>/usr/local/nagios/etc/nrpe.cfg
echo "command[check_disk]=/usr/local/nagios/libexec/check_disk -w 20% -c 8% -p /">>/usr/local/nagios/etc/nrpe.cfg
echo "command[check_swap]=/usr/local/nagios/libexec/check_swap -w 20% -c 10%">>/usr/local/nagios/etc/nrpe.cfg
echo "command[check_iostat]=/usr/local/nagios/libexec/check_iostat -w 6 -c 10">>/usr/local/nagios/etc/nrpe.cfg
8、启动nrpe守护进程,并将启动命令放到启动文件rc.local中。
[root@lnmp01 tools]# /usr/local/nagios/bin/nrpe -c /usr/local/nagios/etc/nrpe.cfg -d

[root@lnmp01 tools]# echo "/usr/local/nagios/bin/nrpe -c /usr/local/nagios/etc/nrpe.cfg -d" >>/etc/rc.local
查看nrpe进程:
[root@lnmp01 tools]# ps -ef |grep nrpe
nagios    61056      1  0 19:19 ?        00:00:00 /usr/local/nagios/bin/nrpe -c /usr/local/nagios/etc/nrpe.cfg -d

[root@lnmp01 tools]# netstat -lntup|grep nrpe
tcp        0      0 0.0.0.0:5666                0.0.0.0:*                   LISTEN      61056/nrpe
nagios服务端的配置
nagios的配置文件有主配置文件nagios.cfg和其他配置文件,其他配置文件是包含在nagios.cfg主配置文件中的,也就是说nagios.cfg主配置文件include其他配置文件,用tree查看
[root@nagios-srv etc]# tree /usr/local/nagios/etc/
/usr/local/nagios/etc/
|-- cgi.cfg
|-- htpasswd.users
|-- nagios.cfg
|-- nrpe.cfg
|-- objects
|   |-- commands.cfg
|   |-- contacts.cfg
|   |-- localhost.cfg
|   |-- printer.cfg
|   |-- switch.cfg
|   |-- templates.cfg
|   |-- timeperiods.cfg
|   `-- windows.cfg
`-- resource.cfg
在nagios主配置文件中可以使用cfg_file来指定其他配置文件,用cfg_dir来指定要包含的存放其他配置文件的目录,配置调整如下所示:
[root@nagios-srv etc]# vim nagios.cfg
# You can specify individual object config files as shown below:
cfg_file=/usr/local/nagios/etc/objects/commands.cfg
cfg_file=/usr/local/nagios/etc/objects/contacts.cfg
cfg_file=/usr/local/nagios/etc/objects/timeperiods.cfg
cfg_file=/usr/local/nagios/etc/objects/templates.cfg
cfg_file=/usr/local/nagios/etc/objects/services.cfg
cfg_file=/usr/local/nagios/etc/objects/hosts.cfg

#这个地方要对localhost.cfg配置文件注释掉
#cfg_file=/usr/local/nagios/etc/objects/localhost.cfg

cfg_dir=/usr/local/nagios/etc/services
#cfg_dir=/usr/local/nagios/etc/printers
#cfg_dir=/usr/local/nagios/etc/switches
#cfg_dir=/usr/local/nagios/etc/routers
主配置文件nagios.cfg的配置services、hosts默认是没有的,是我们自己自定义的,所以要手动添加这些配置文件和目录
[root@nagios-srv etc]# mkdir  services
[root@nagios-srv etc]# chown -R nagios.nagios  services

[root@nagios-srv etc]# head -51 objects/localhost.cfg>objects/hosts.cfg
[root@nagios-srv objects]# chown nagios.nagios  hosts.cfg
[root@nagios-srv objects]# touch services.cfg
[root@nagios-srv objects]# chown nagios.nagios  services.cfg
nagios的监控模式和监控模式的选择
nagios的监控模式分为:主动模式和被动模式
主动模式是nagios服务端主动请求监控客户端状态,不需要客户端的nrpe的支持,是利用服务端的插件要获取数据
被动模式是nagios服务端通过check_nrpe插件,和客户端nrpe进程沟通,调用本地插件获取数据
nagios的被动模式的配置:
配置hosts.cfg配置文件及根据提示的错误配置其他文件
[root@nagios-srv ~]# cd /usr/local/nagios/etc/objects/
[root@nagios-srv objects]# vim  hosts.cfg
# Define a host for the local machine

define host{
        use                     linux-server
        host_name               103.lnmp01
        alias                   103.lnmp01
        address                 192.168.1.103
        }
define host{
        use                     linux-server
        host_name               nagios_server
        alias                   nagios_server
        address                 192.168.1.102
        }

define hostgroup{
        hostgroup_name  linux-servers ; The name of the hostgroup
        alias           Linux Servers ; Long name of the group
        members         103.lnmp01,nagios_server
        }
配置文件配置完后,检查语法 /etc/init.d/nagios checkconfig,这时候会提示有错,但是没有提示出错在哪儿,但是用/usr/local/nagios/bin/nagios -v /usr/local/nagios/etc/nagios.cfg 却可以显示出错的位置
这是由/etc/init.d/nagios的启动脚本控制的,修改脚本如下,将$NagiosBin -v $NagiosCfgFile > /dev/null 2>&1;的错误定向到空去掉就好了
[root@nagios-srv objects]# vim /etc/init.d/nagios
checkconfig)
                printf "Running configuration check..."
                $NagiosBin -v $NagiosCfgFile;
                if [ $? -eq 0 ]; then
                        echo " OK."
                else
                        echo " CONFIG ERROR!  Check your Nagios configuration."
                        exit 1
                fi
                ;;
然后再用 /etc/init.d/nagios checkconfig检查语法就会提示错误的位置了
[root@nagios-srv objects]# /etc/init.d/nagios checkconfig
Checking services...
Error: There are no services defined!
        Checked 0 services.
Total Warnings: 2
Total Errors:   1
提示错误为没有services,那么接下来编辑services.cfg
[root@nagios-srv objects]# vim  services.cfg

define service{
        use             generic-service
        host_name       103.lnmp01
        service_description     Disk Partition
        check_command   check_nrpe!check_disk
}
define service{
        use             generic-service
        host_name       103.lnmp01
        service_description     Memory infomation
        check_command   check_nrpe!check_mem
}
再检查语法/etc/init.d/nagios checkconfig依然有报错,报错如下:
[root@nagios-srv objects]# /etc/init.d/nagios checkconfig
Checking services...
Error: Service check command 'check_nrpe check_mem' specified in service 'Disk Partition' for host '103.lnmp01' not defined anywhere!
Total Warnings: 1
Total Errors:   1
这个报错为没有定义check_nrpe和check_mem命令,我们知道定制nagios命令是在命令配置文件commands.cfg中,接下来修改commands.cfg配置文件如下:
在配置文件中添加定义check_nrpe和check_mem命令
[root@nagios-srv objects]# vim  commands.cfg
# 'check_nrpe' command definition
define command{
        command_name    check_nrpe
        command_line    $USER1$/check_nrpe -H $HOSTADDRESS$ -c $ARG1$
        }
# 'check_memory' command definition
define command{
        command_name    check_mem
        command_line    $USER1$/check_memory.pl -H $HOSTADDRESS$ -c $ARG1$
        }
这时候再检查语法就没错误了,根据commands.cfg配置文件中的定义check_nrpe命令来测试下是否可以监控
[root@nagios-srv etc]# /usr/local/nagios/libexec/check_nrpe -H  192.168.1.103 -c check_disk

DISK OK - free space: / 5836 MB (66% inode=84%);| /=2936MB;7399;8509;0;9249

[root@nagios-srv objects]# /usr/local/nagios/libexec/check_nrpe -H  192.168.1.103 -c check_mem
CHECK_MEMORY OK - 359M free | free=376508416b;29873356.8:;14936678.4:
浏览器打开http://192.168.1.102/nagios/ 这时候会报一个cgi错误,这是权限问题,默认nagios的授权是nagiosadmin,而我们使用的监控用户时oldboy,所以讲cgi,cfg的配置文件中的nagiosadmin替换成oldboy即可
[root@nagios-srv etc]# vim  cgi.cfg
authorized_for_all_service_commands=oldboy
authorized_for_all_host_commands=oldboy

#在vim中使用g/nagiosadmin/s//oldboy/g将nagiosadmin全部改成oldboy

#重启nagios服务
/etc/init.d/nagios  reload
nagios的主动模式配置
nagios主动模式是有nagios服务端主动发起的监控,比如对客户端url、端口的监控,可以通过help的命令查看命令格式
对客户端url的监控命令参数帮助:
[root@nagios-srv objects]# /usr/local/nagios/libexec/check_http --help
Usage:
 check_http -H <vhost> | -I <IP-address> [-u <uri>] [-p <port>]
       [-w <warn time>] [-c <critical time>] [-t <timeout>] [-L] [-a auth]
       [-b proxy_auth] [-f <ok|warning|critcal|follow|sticky|stickyport>]
       [-e <expect>] [-s string] [-l] [-r <regex> | -R <case-insensitive regex>]
       [-P string] [-m <min_pg_size>:<max_pg_size>] [-4|-6] [-N] [-M <age>]
       [-A string] [-k string] [-S <version>] [--sni] [-C <warn_age>[,<crit_age>]]
       [-T <content-type>] [-j method]
对客户端端口的监控命令参数帮助:
[root@nagios-srv objects]# /usr/local/nagios/libexec/check_tcp --help
Usage:
check_tcp -H host -p port [-w <warning time>] [-c <critical time>] [-s <send string>]
[-e <expect string>] [-q <quit string>][-m <maximum bytes>] [-d <delay>]
[-t <timeout seconds>] [-r <refuse state>] [-M <mismatch state>] [-v] [-4|-6] [-j]
[-D <warn days cert expire>[,<crit days cert expire>]] [-S <use SSL>] [-E]
由于nagios的主配置文件中指定了这个目录cfg_dir=/usr/local/nagios/etc/services,那么我们就可以在这个目录下自定义配置文件来对nagios的客户端主动监控
1、比如对主域名进行监控,定义一个http-url.cfg配置文件
[root@nagios-srv services]# vim  http-url.cfg

define service{
        use             generic-service
        host_name       103.lnmp01
        service_description     blog_url monitor
        check_command   check_weburl!-H blog.etiantian.org
        max_check_attempts      3
        normal_check_interval   2
        retry_check_interval    1
        check_period            24x7
        notification_interval   30
        notification_period     24x7
        notification_options    w,u,c,r
        contact_groups          admins
}
然后在commands.cfg配置文件中对自定义的配置文件http-url.cfg中的自定义命令名check_weburl进行配置
[root@nagios-srv objects]# vim  commands.cfg
# 'check_http_url' command definition
define command{
        command_name    check_weburl
        command_line    $USER1$/check_http $ARG1$ -w 10 -c 30
        }
检查语法并重启nagios服务/etc/init.d/nagios reload
不仅可以对主域名的监控,其实也可以对主域名下的url进行监控,例如:
[root@nagios-srv services]# vim  http-url.cfg
define service{
        use             generic-service
        host_name       103.lnmp01
        service_description     monitor url /upload/test.html
        check_command   check_weburl!-H blog.etiantian.org -u /upload/test.html
        max_check_attempts      3
        normal_check_interval   2
        retry_check_interval    1
        check_period            24x7
        notification_interval   30
        notification_period     24x7
        notification_options    w,u,c,r
        contact_groups          admins
}
如果主域名下的url路径很复杂的话,比如动态的url,在定义service的时候应该在-u 参数后的的url路径上加上引号。例如:check_command check_weburl!-H blog.etiantian.org -u "/dynamic/?article=1&u=2"
然后重启nagios服务即可/etc/init.d/nagios reload
那么用域名的监控对于集群下面的节点怎么监控呢,这就要用到别名对集群下面同样节点的url监控
2、对客户端的端口进行监控
对端口监控用check_tcp插件,而这个插件的命令已经在commands.cfg配置文件中已经定义了,我们就可以直接使用
# 'check_tcp' command definition
define command{
        command_name    check_tcp
        command_line    $USER1$/check_tcp -H $HOSTADDRESS$ -p $ARG1$ $ARG2$
        }
根据check_tcp在commands.cfg配置文件中命令定义格式,在services目录中创建一个对端口监控的配置文件
[root@nagios-srv services]# vim  monitor-port.cfg

define service{
        use             generic-service
        host_name       103.lnmp01
        service_description     Monitor Port-80
        check_command   check_tcp!80
        max_check_attempts      3
        normal_check_interval   2
        retry_check_interval    1
        check_period            24x7
        notification_interval   30
        notification_period     24x7
        notification_options    w,u,c,r
        contact_groups          admins
}
这样重启nagios服务即可。对于端口的监控还有很多,比如可以对mysql的3306端口监控,ssh的22端口监控等所以的端口进行监控
由于主动模式监控和被动模式监控可以互换的,那么下面尝试对80端口的主动模式换成被动模式
修改客户端的nrpe.cfg配置文件,添加一个check_port_80的插件命令如下:
[root@lnmp01 upload]# vim /usr/local/nagios/etc/nrpe.cfg
command[check_port_80]=/usr/local/nagios/libexec/check_tcp -H 192.168.1.103 -p 8
0
重启nrpe客户端
这时候在服务端用被动模式是否可以监控到客户端的80端口: /usr/local/nagios/libexec/check_nrpe -H 192.168.1.103 -c check_port_80 ,测试没问题就可以在服务端配置services了
[root@nagios-srv services]# vim http-url.cfg
define service{
        use             generic-service
        host_name       103.lnmp01
        service_description     beidong-monitor 103.lnmp01-port-80
        check_command   check_nrpe!check_port_80
        max_check_attempts      3
        normal_check_interval   2
        retry_check_interval    1
        check_period            24x7
        notification_interval   30
        notification_period     24x7
        notification_options    w,u,c,r
        contact_groups          admins
}
重启服务端的nagios服务,这时候nagios服务端就可以被动的监控客户端的80端口了
3、nagios的模板定义
由于在配置host.cfg、services.cfg,还有其他的一些配置文件中基本上都要用到模板,有了这些模板再编辑这些配置文件的时候就方便许多了,只要在定义的模板中将公用的数据放到模板中,其他的配置文件然后调用这些模板即可。
比如对services.cfg的配置用模板定义的方式设置,首先在templates.cfg的模板配置文件中自定义一个模板generic-goser-service,将services.cfg中公用的部分全部放在这个模板中
[root@nagios-srv objects]# vim templates.cfg
define service{
        name                            generic-goser-service
        active_checks_enabled           1
        passive_checks_enabled          1
        parallelize_check               1
        obsess_over_service             1
        check_freshness                 0
        notifications_enabled           1
        event_handler_enabled           1
        flap_detection_enabled          1
        failure_prediction_enabled      1
        process_perf_data               1
        retain_status_information       1
        retain_nonstatus_information    1
        is_volatile                     0
        check_period                    24x7
        max_check_attempts              2
        normal_check_interval           2
        retry_check_interval            2
        contact_groups                  admins
        notification_options            w,u,c,r
        notification_interval           10
        notification_period             24x7
         register                        0
        }
然后再services.cfg中就可以调用这个模板
[root@nagios-srv objects]# vim  services.cfg
define service{
        use             generic-goser-service
        host_name       103.lnmp01
        service_description     Disk Partition
        check_command   check_nrpe!check_disk
}
define service{
        use             generic-goser-service
        host_name       103.lnmp01
        service_description     Memory infomation
        check_command   check_nrpe!check_mem
}
define service{
        use             generic-goser-service
        host_name       103.lnmp01
        service_description     Load infomation
        check_command   check_nrpe!check_load
}
define service{
        use             generic-goser-service
        host_name       103.lnmp01
        service_description     Swap status
        check_command   check_nrpe!check_swap
}
define service{
        use             generic-goser-service
        host_name       103.lnmp01
        service_description     IO status
        check_command   check_nrpe!check_iostat
}
同理对主机的配置文件hosts.cfg也一样在templates.cfg中定义模板,然后再hosts.cfg配置文件中调用;
警报连接人模板在contacts.cfg中定义,然后在services.cfg等配置文件中调用,如下对contacts.cfg做自定义的警报联系人设置
define contact{
        contact_name                    goser01
        use                             generic-contact
        alias                           Nagios Admin
        email                           goser01@163.com
        }
define contact{
        contact_name                    goser02
        use                             generic-contact
        alias                           Nagios Admin
        email                           goser02@163.com
        }
define contactgroup{
        contactgroup_name       sas
        alias                   Nagios Administrators
        members                 goser01,goser02
        }
然后就可在services.cfg配置文件的模板中将自定义好的报警联系人配置进去,这样报警就会发送给模板中定义好的联系人了。
[root@nagios-srv objects]# vim  templates.cfg
contact_groups                  admins,sas
当然还可对周期配置文件模板做自定义,然后将定义好的周期让sercices.cfg和其他配置来使用,周期配置文件内容为:
[root@nagios-srv objects]# less timeperiods.cfg
###############################################################################
# TIMEPERIODS.CFG - SAMPLE TIMEPERIOD DEFINITIONS
#
# Last Modified: 05-31-2007
#
# NOTES: This config file provides you with some example timeperiod definitions
#        that you can reference in host, service, contact, and dependency
#        definitions.
#
#        You don't need to keep timeperiods in a separate file from your other
#        object definitions.  This has been done just to make things easier to
#        understand.
#
###############################################################################


###############################################################################
###############################################################################
#
# TIME PERIODS
#
###############################################################################
###############################################################################

# This defines a timeperiod where all times are valid for checks,
# notifications, etc.  The classic "24x7" support nightmare. :-)
define timeperiod{
        timeperiod_name 24x7
        alias           24 Hours A Day, 7 Days A Week
        sunday          00:00-24:00
        monday          00:00-24:00
        tuesday         00:00-24:00
        wednesday       00:00-24:00
        thursday        00:00-24:00
        friday          00:00-24:00
        saturday        00:00-24:00
        }


# 'workhours' timeperiod definition
define timeperiod{
        timeperiod_name workhours
        alias           Normal Work Hours
        monday          09:00-17:00
        tuesday         09:00-17:00
        wednesday       09:00-17:00
        thursday        09:00-17:00
        friday          09:00-17:00
        }


# 'none' timeperiod definition
define timeperiod{
        timeperiod_name none
        alias           No Time Is A Good Time
        }


# Some U.S. holidays
# Note: The timeranges for each holiday are meant to *exclude* the holidays from being
# treated as a valid time for notifications, etc.  You probably don't want your pager
# going off on New Year's.  Although you're employer might... :-)
define timeperiod{
        name                    us-holidays
        timeperiod_name         us-holidays
        alias                   U.S. Holidays

        january 1               00:00-00:00     ; New Years
        monday -1 may           00:00-00:00     ; Memorial Day (last Monday in May)
        july 4                  00:00-00:00     ; Independence Day
        monday 1 september      00:00-00:00     ; Labor Day (first Monday in September)
        thursday 4 november     00:00-00:00     ; Thanksgiving (4th Thursday in November)
        december 25             00:00-00:00     ; Christmas
        }


# This defines a modified "24x7" timeperiod that covers every day of the
# year, except for U.S. holidays (defined in the timeperiod above).
define timeperiod{
        timeperiod_name 24x7_sans_holidays
        alias           24x7 Sans Holidays

        use             us-holidays             ; Get holiday exceptions from other timeperiod

        sunday          00:00-24:00
        monday          00:00-24:00
        tuesday         00:00-24:00
        wednesday       00:00-24:00
        thursday        00:00-24:00
        friday          00:00-24:00
        saturday        00:00-24:00
        }
将来服务多的话,可以对服务进行分组,就像上面对主机分组一样,比如:
[root@nagios-srv services]# vim servergroup.cfg
define servicegroup{
	servicegroup_name Swap Useage
	alias	Linux Servers;Long name of the group
	members 103.lnmp01,Swap Useage,105.mysql,Swap Useage
}
这里的Swap要和swap定义的服务的描述要一致,否则会报错。
nagios监控的图形显示和管理
1、安装图形显示的支持库
yum install cairo pango zlib zlib-devel freetype freetype-devel gd gd-devel -y
2、安装rrdtool,即轮询的数据库工具,和依赖包,比如可以按照每周,每月等出图,需要安装libart_lgpl依赖包
这里用编译安装libart_lgpl
cd /home/oldboy/tools
wget http://ftp.acc.umu.se/pub/gnome/sources/libart_lgpl/2.3/libart_lgpl-2.3.17.tar.gz
tar xf libart_lgpl-2.3.17.tar.gz
cd libart_lgpl-2.3.17
./configure
make && make install
cp  -r  /usr/local/include/libart-2.0 /usr/include
cd ..
安装rrdtool,这是一个专门用来画图的工具
wget https://oss.oetiker.ch/rrdtool/pub/rrdtool-1.2.14.tar.gz
tar  xf  rrdtool-1.2.14.tar.gz
cd rrdtool-1.2.14
./configure --prefix=/usr/local/rrdtool  --disable-python --disable-tcl
make && make install
cd ..
3、安装pnp软件,pnp是出图软件,是收集完数据通过rrdtool画图,最后再显示图的效果
wget https://sourceforge.net/projects/pnp4nagios/files/PNP/pnp-0.4.14/pnp-0.4.14.tar.gz
tar  xf  pnp-0.4.14.tar.gz
cd pnp-0.4.14
./configure  --with-rrdtool=/usr/local/rrdtool/bin/rrdtool --with-perfdata-dir=/usr/local/nagios/share/perdata/
make all
make install
make install-config
make install-init
查看是否生成了收集数据来出图的脚本:
[root@nagios-srv pnp-0.4.14]# ll /usr/local/nagios/libexec/ |grep process
-rwxr-xr-x 1 nagios nagios  31826 Oct 14 16:53 process_perfdata.pl
4、调整nagios.cfg主配置文件,process_perfdata=1让其可以收集数据,同时打开主机收集数据和服务收集数据
[root@nagios-srv etc]# vim  nagios.cfg
# Values: 1 = process performance data, 0 = do not process performance data

process_performance_data=1

host_perfdata_command=process-host-perfdata
service_perfdata_command=process-service-perfdata
5、调整commands.cfg配置文件,删除默认的主机和服务的出图收集脚本的方式,我们要重新定义
[root@nagios-srv objects]# vim  commands.cfg
# 'process-host-perfdata' command definition
define command{
        command_name    process-host-perfdata
        command_line    /usr/bin/printf "%b" "$LASTHOSTCHECK$\t$HOSTNAME$\t$HOST
STATE$\t$HOSTATTEMPT$\t$HOSTSTATETYPE$\t$HOSTEXECUTIONTIME$\t$HOSTOUTPUT$\t$HOST
PERFDATA$\n" >> /usr/local/nagios/var/host-perfdata.out
        }


# 'process-service-perfdata' command definition
define command{
        command_name    process-service-perfdata
        command_line    /usr/bin/printf "%b" "$LASTSERVICECHECK$\t$HOSTNAME$\t$S
ERVICEDESC$\t$SERVICESTATE$\t$SERVICEATTEMPT$\t$SERVICESTATETYPE$\t$SERVICEEXECU
TIONTIME$\t$SERVICELATENCY$\t$SERVICEOUTPUT$\t$SERVICEPERFDATA$\n" >> /usr/local
/nagios/var/service-perfdata.out
        }
将上面删除的内容重新定义为:
# 'process-host-perfdata' command definition
define command{
        command_name    process-host-perfdata
        command_line    /usr/local/nagios/libexec/process_perfdata.pl
        }

# 'process-service-perfdata' command definition
define command{
        command_name    process-service-perfdata
        command_line    /usr/local/nagios/libexec/process_perfdata.pl
        }
从新启动nagios服务,这时候访问http://192.168.1.102/nagios/pnp/index.php便可以正常出图了
6、配置主机出图
因为主机使用的模板为:linux-server,所以在模板中对主机统一配置:
[root@nagios-srv objects]# cat hosts.cfg
define host{
        use                     linux-server
        host_name               103.lnmp01
        alias                   103.lnmp01
        address                 192.168.1.103
        }
[root@nagios-srv objects]# vim templates.cfg

define host{
        name                            linux-server
        #配置action_url指定的主机
        action_url                      /nagios/pnp/index.php?host=$HOSTNAME$
        }
6、服务出图
可以在单个服务中配置出图,当然也可以在服务模板中对所有服务做统一出图
下面对模板做配置,对所有服务做出图处理 action_url /nagios/pnp/index.php?host=$HOSTNAME$&srv=$SERVICEDESC$
[root@nagios-srv objects]# vim  templates.cfg
define service{
        name                            generic-goser-service
        action_url              /nagios/pnp/index.php?host=$HOSTNAME$&srv=$SERVI
CEDESC$
        }

[root@nagios-srv objects]# /etc/init.d/nagios checkconfig
[root@nagios-srv objects]# /etc/init.d/nagios reload
自定义插件
自定义插件可以用c c++ python java shell等来开发。nagios插件提供两个返回值,一个是插件的退出状态码,另一个是插件在控制台打印的第一行数据。
nagios主程序可识别的状态码为:
OK		#退出代码0 --表示服务正常工作
WARNING		#退出代码1 --表示服务处于警告状态
CRITICAL	#退出代码2 --表示服务处于紧急,严重状态
UNKNOWN		#退出代码3 --表示服务处于未知状态
这些状态可以在utils.sh插件中查看到
[root@nagios-srv ~]# cat /usr/local/nagios/libexec/utils.sh
#! /bin/sh

STATE_OK=0
STATE_WARNING=1
STATE_CRITICAL=2
STATE_UNKNOWN=3
STATE_DEPENDENT=4
我们现在用shell来开发一个验证密码文件是否被修改的简单插件,配置如下
在nagios客户端生成一个MD5密码文件:
[root@lnmp01 ~]# md5sum /etc/passwd>/etc/goser.md5

#通过md5sum -c  /etc/goser.md5验证passwd文件是否被修改
在/usr/local/nagios/libexec/目录下编写一个shell脚本:check_passwd
[root@lnmp01 ~]# vim  /usr/local/nagios/libexec/check_passwd

#!/bin/sh
char=`md5sum -c /etc/goser.md5 2>/dev/null|grep "OK"|wc -l`
if [ $char -eq 1 ];then
        echo "Passwd is ok"
        exit 0
else
        echo "Passwd is changed"
        exit 2
fi
验证脚本是否能够正确执行:
[root@lnmp01 ~]# sh  /usr/local/nagios/libexec/check_passwd
Passwd is ok
[root@lnmp01 ~]# useradd test02
[root@lnmp01 ~]# sh  /usr/local/nagios/libexec/check_passwd
Passwd is changed
要监控客户端密码文件是否变化,只能用nrpe的被动模式,所以就要在客户端的nrpe.cfg配置文件做如下配置
[root@lnmp01 ~]# vim  /usr/local/nagios/etc/nrpe.cfg
command[check_passwd]=/usr/local/nagios/libexec/check_passwd
重启nrpe服务,使nrpe.cfg配置文件生效。
nagios的服务配置文件配置如下:
[root@nagios-srv objects]# vim  services.cfg
define service{
        use             generic-goser-service
        host_name       103.lnmp01
        service_description     Monitor /etc/passwd
        check_command   check_nrpe!check_passwd
}
验证服务端用nagios监控客户端passwd文件变化
#客户端passwd文件没有修改前
[root@nagios-srv ~]# /usr/local/nagios/libexec/check_nrpe -H 192.168.1.103 -c check_passwd
Passwd is ok

#客户端passwd文件修改后,再测试
#[root@lnmp01 ~]# useradd test03
[root@nagios-srv ~]# /usr/local/nagios/libexec/check_nrpe -H 192.168.1.103 -c check_passwd
Passwd is changed
报警配置
1、添加联系人和组contacts.cfg
define contact{
        contact_name                    goser01
        use                             generic-contact
        alias                           Nagios Admin
        email                           goser01@163.com
        }
define contact{
        contact_name                    goser02
        use                             generic-contact
        alias                           Nagios Admin
        email                           goser02@163.com
        }
define contactgroup{
        contactgroup_name       sas
        alias                   Nagios Administrators
        members                 goser01,goser02
        }
2、添加报警的命令commands.cfg

 浙公网安备 33010602011771号