maptalks 开发GIS地图(25)maptalks.three.18 - custom-billboard
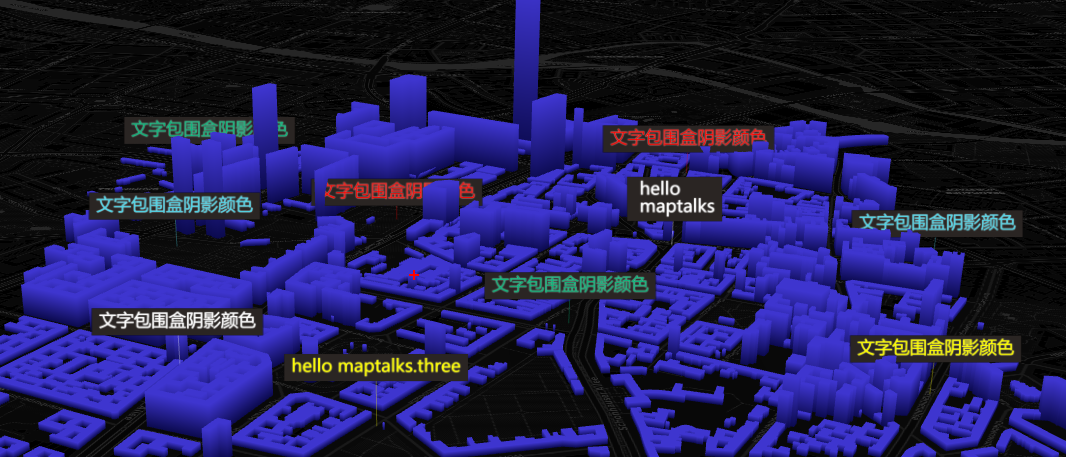
1. 广告牌的效果,关键是每个的样式和颜色可以自定义。
2. 从代码中可以看出,使用了 canvas ,并将对应的 canvas 转化为image。
自己的功力不够,只能看出来这一点,还不知道对不对。等回来找本 ThreeJS 的书看。
3. 初始化数据
 1  function initData() {
 2             data.forEach(element => {
 3                 const style = {
 4                     x: width * Math.random(),
 5                     y: height * Math.random(),
 6                     text: element.text,
 7                     // width: 50,
 8                     height: 50,
 9                     textFill: element.color,
10                     // scale fontSize 18*2
11                     textFont: '36px Microsoft Yahei',
12                     textBackgroundColor: '#2A2523',
13                     textPadding: [10, 15],
14                     textShadowColor: '#fff',
15                     textShadowBlur: 2
16                 };
17                 const text = new zrender.Text({
18                     style
19                 });
20                 zr.add(text);
21                 const rect = getRect(text.getBoundingRect());
22                 createZr(element, rect, style, function () {
23                     if (list.length === data.length) {
24                         addSprites();
25                     }
26                 });
27             });
28         }
4. 使用 canvas 描述本文对象
 1  function getRect(bound) {
 2             const { width, height, x, y } = bound;
 3             const w = Math.max(2, THREE.Math.ceilPowerOfTwo(width));
 4             const h = Math.max(2, THREE.Math.ceilPowerOfTwo(height));
 5             return {
 6                 width, height, w, h
 7             };
 8         }
 9
10         function createZr(d, rect, style, callback) {
11             const { w, h, width, height } = rect;
12             let canvas = document.createElement('canvas');
13             canvas.width = w;
14             canvas.height = h;
15
16             const zr = zrender.init(canvas, {
17                 width: w,
18                 height: h
19             });
20             const options = Object.assign({}, style);
21             options.x = (w / 2 - width / 2);
22             options.y = (h / 2 - height / 2);
23             const text = new zrender.Text({
24                 style: options
25             });
26             zr.add(text);
27             zr.on('rendered', () => {
28                 d.image = canvas.toDataURL();
29                 d.rect = rect;
30                 list.push(d);
31                 callback();
32                 zr.dispose();
33                 canvas = null;
34             })
35
36         }
5. 页面显示
6. 源码地址
https://github.com/WhatGIS/maptalkMap/tree/main/threelayer/demo

 浙公网安备 33010602011771号