maptalks 开发GIS地图(13)maptalks.three.06 bars
1. 说明
使用柱状图,并根据音乐节奏显示动画效果。
2. 初始化地图并添加threelayer
1 var map = new maptalks.Map("map", { 2 center: [19.06325670775459, 42.16842479475318], 3 zoom: 3, 4 pitch: 60, 5 // bearing: 180, 6 7 centerCross: true, 8 doubleClickZoom: false, 9 // baseLayer: new maptalks.TileLayer('tile', { 10 // urlTemplate: 'https://{s}.basemaps.cartocdn.com/dark_all/{z}/{x}/{y}.png', 11 // subdomains: ['a', 'b', 'c', 'd'], 12 // attribution: '© <a href="http://osm.org">OpenStreetMap</a> contributors, © <a href="https://carto.com/">CARTO</a>' 13 // }) 14 }); 15 16 // the ThreeLayer to draw buildings 17 var threeLayer = new maptalks.ThreeLayer('t', { 18 forceRenderOnMoving: true, 19 forceRenderOnRotating: true 20 // animation: true 21 }); 22 threeLayer.prepareToDraw = function (gl, scene, camera) { 23 stats = new Stats(); 24 stats.domElement.style.zIndex = 100; 25 document.getElementById('map').appendChild(stats.domElement); 26 27 var light = new THREE.DirectionalLight(0xffffff); 28 light.position.set(0, -10, 10).normalize(); 29 scene.add(light); 30 31 scene.add(new THREE.AmbientLight(0xffffff, 0.2)); 32 33 // camera.add(new THREE.PointLight(0xffffff, 1)); 34 35 addBars(scene); 36 37 }; 38 threeLayer.addTo(map);
3. 添加数据
  1 function addBars(scene) {
  2             fetch('./data/population.json').then((function (res) {
  3                 return res.json();
  4             })).then(function (json) {
  5                 const data = json.filter(function (dataItem) {
  6                     return dataItem[2] > 0;
  7                 }).map(function (dataItem) {
  8                     dataItem[2] *= 400;
  9                     min = Math.min(min, dataItem[2]);
 10                     max = Math.max(max, dataItem[2]);
 11                     return {
 12                         coordinate: dataItem.slice(0, 2),
 13                         height: dataItem[2],
 14                         radius: 15000,
 15                         // topColor: '#fff'
 16                     }
 17                 }).slice(0, Infinity);
 18                 const colorMap = {};
 19                 data.forEach(d => {
 20                     const { height } = d;
 21                     const color = getColor(height);
 22                     if (!colorMap[color]) {
 23                         const m = material.clone();
 24                         m.color.set(color);
 25                         colorMap[color] = {
 26                             data: [],
 27                             material: m
 28                         }
 29                     }
 30                     colorMap[color].data.push(d);
 31                 });
 32                 console.log(colorMap);
 33                 const time = 'time';
 34                 console.time(time);
 35                 for (let color in colorMap) {
 36                     const { data, material } = colorMap[color];
 37                     const mesh = threeLayer.toBars(data, { interactive: false }, material);
 38                     bars.push(mesh);
 39                 }
 40                 console.timeEnd(time);
 41                 bars.forEach(mesh => {
 42                     mesh.setToolTip('hello', {
 43                         showTimeout: 0,
 44                         eventsPropagation: true,
 45                         dx: 10
 46                     });
 47
 48                     //infowindow test
 49                     mesh.setInfoWindow({
 50                         content: 'hello world',
 51                         title: 'message',
 52                         animationDuration: 0,
 53                         autoOpenOn: false
 54                     });
 55
 56                     //event test
 57                     ['click', 'mousemove', 'empty', 'mouseout', 'mouseover', 'mousedown', 'mouseup', 'dblclick', 'contextmenu'].forEach(function (eventType) {
 58                         mesh.on(eventType, function (e) {
 59                             // console.log(e.type);
 60                             const select = e.selectMesh;
 61                             if (e.type === 'empty' && selectMesh.length) {
 62                                 threeLayer.removeMesh(selectMesh);
 63                                 selectMesh = [];
 64                             }
 65
 66                             let data, baseObject;
 67                             if (select) {
 68                                 data = select.data;
 69                                 baseObject = select.baseObject;
 70                                 if (baseObject && !baseObject.isAdd) {
 71                                     baseObject.setSymbol(highlightmaterial);
 72                                     threeLayer.addMesh(baseObject);
 73                                     selectMesh.push(baseObject);
 74                                 }
 75                             }
 76
 77
 78                             if (selectMesh.length > 20) {
 79                                 threeLayer.removeMesh(selectMesh);
 80                                 selectMesh = [];
 81                             }
 82
 83
 84                             // override tooltip
 85                             if (e.type === 'mousemove' && data) {
 86                                 const height = data.height;
 87                                 const tooltip = this.getToolTip();
 88                                 tooltip._content = `height:${height}`;
 89                             }
 90                             //override infowindow
 91                             if (e.type === 'click' && data) {
 92                                 const height = data.height;
 93                                 const infoWindow = this.getInfoWindow();
 94                                 infoWindow.setContent(`height:${height}`);
 95                                 if (infoWindow && (!infoWindow._owner)) {
 96                                     infoWindow.addTo(this);
 97                                 }
 98                                 this.openInfoWindow(e.coordinate);
 99
100                             }
101                         });
102                     });
103                 });
104                 console.log(bars);
105                 threeLayer.addMesh(bars);
106                 initGui();
107                 animation();
108             });
109         }
4. 数据使用的是 ./data/population.json
这里的是数据原始格式:

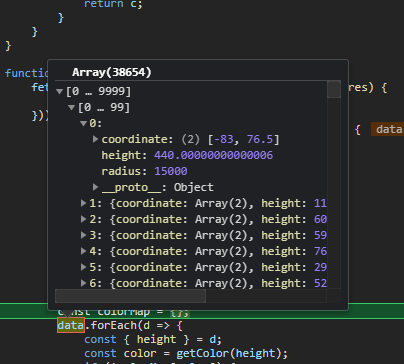
下面的这段代码,将这个数据重新生成了一次,把前两个数据作为 coordinate,将最后一个数据乘以 400 作为高度。
然后将 15000 作为了圆柱的半径。
1  dataItem[2] *= 400;
2  min = Math.min(min, dataItem[2]);
3  max = Math.max(max, dataItem[2]);
4  return {
5        coordinate: dataItem.slice(0, 2),
6        height: dataItem[2],
7        radius: 15000,
8        // topColor: '#fff'
9 }
最终的数据变为了下面的样式。
别问我那个数据为啥是 440.00000000000006 😭

5. 显示效果
效果还是不错的。

6. 源码参考
https://github.com/WhatGIS/maptalkMap


