MySQL异常OOM排查
收到告警,提示mysql挂了,此时看监控,负载已经比较高,服务器已经无法登录。看见监控此时的负载情况如下:

除了系统层面的监控还可以看到,mysql层面的监控已经断图,等负载降下来的时候mysql已经被oom,自动重启了。

从mysql错误日志看到如下信息:
2020-08-01T09:14:11.778918+08:00 0 [Note] InnoDB: page_cleaner: 1000ms intended loop took 4271ms. The settings might not be optimal. (flushed=386 and evicted=119, during the time.)
这基本上说明,数据库收到的写入过多,导致BufferPool充满脏页。这会触发PageCleaner进行操作并清除脏页。由于脏页比平时多,因此PageCleaner清除缓冲区需要花费更多时间。
由于监控在负载异常高的这段时间msyql层面已经断图,看不到相关监控,那么如何排查呢?那只能从binlog入手了,好,那么分析一下binlog,看有没有大事务之类的。
mysqlbinlog mysql-bin.005298 | grep "GTID$(printf '\t')last_committed" -B 1 | egrep -E '^# at|^#20' | awk '{print $1,$2,$3}' | sed 's/server//' | sed 'N;s/\n/ /' | awk 'NR==1 {tmp=$1} NR>1 {print $4,$NF,($3-tmp);tmp=$3}' | sort -k 3 -n -r | head -n 20
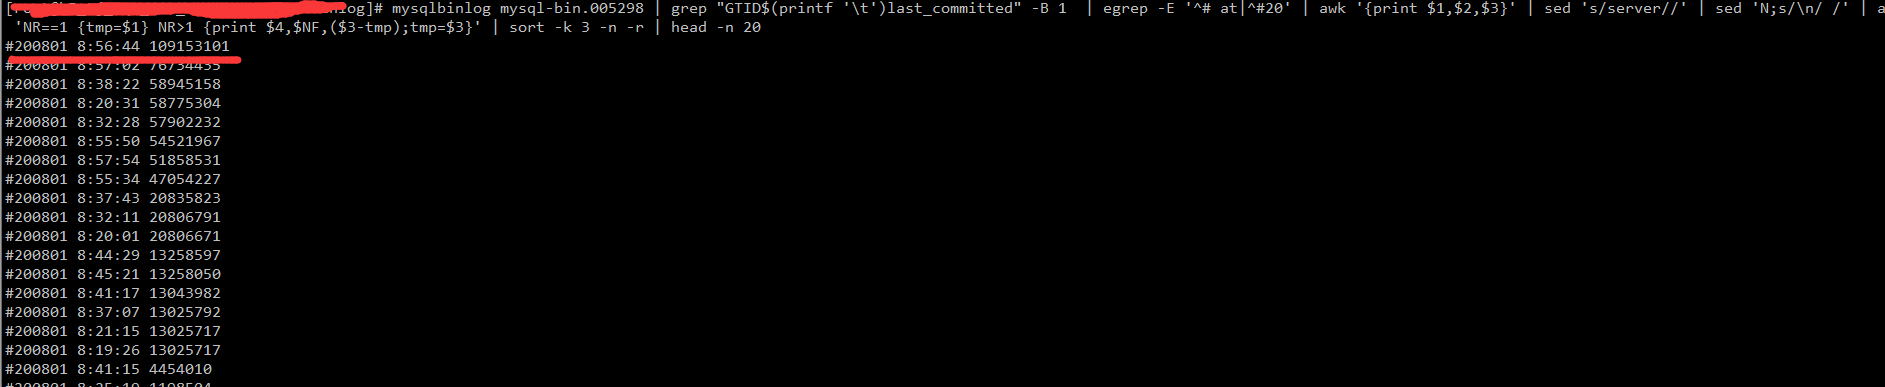
可以看见再8:56:44左右,可以看见最大的一个事务在100M,这是比较大了。通过在该时间范围内继续解析binlog,发现有大范围的更新数据。这不够直观,我们写一段代码,把DML趋势放入ES来分析一下,代码比较简单,如下:


#!/usr/bin/python
#coding: utf8
""" 跟踪一段时间内dml趋势,用ES分析
Usage:
python dml2es.py | logstash -f /etc/logstash/conf.d/t_binlog.conf

"""
import json
import os
import sys
import logging
from datetime import datetime
from pymysqlreplication import BinLogStreamReader
from pymysqlreplication.event import QueryEvent, RotateEvent
from pymysqlreplication.row_event import (
    WriteRowsEvent,
    UpdateRowsEvent,
    DeleteRowsEvent,
)

def init_log():
    # get root logger
    mylogger = logging.getLogger()
    mylogger.setLevel(logging.DEBUG)

    # create file handler and add formatter to handler
    verbose_log_file = "/tmp/%s.verbose.log" % (os.path.basename(sys.argv[0]))
    fh = logging.FileHandler(verbose_log_file)
    fh.setLevel(logging.DEBUG)
    fh.setFormatter(logging.Formatter(
        fmt="%(asctime)s %(filename)s:%(lineno)d %(levelname)s %(message)s",
        datefmt="%a %d %b %Y %H:%M:%S"
    ))

    # create stream handler and add formatter to handler
    sh = logging.StreamHandler(sys.stdout)
    sh.setLevel(logging.INFO)
    sh.setFormatter(logging.Formatter(
        fmt="%(asctime)s %(levelname)-8s %(message)s",
        datefmt="%H:%M:%S"
    ))

    # add two handler to logger
    mylogger.addHandler(fh)
    mylogger.addHandler(sh)
    return mylogger


if __name__ == "__main__":
    logger = init_log()
    mysql_settings = {
        'host': '127.0.0.1',
        'port': 3306,
        'user': 'xxx',
        'passwd': 'xxx'
    }

    binlog_file = 'mysql-bin.005298'
    start_position = 123
    stop_position = 1031510925

    # 不需要blocking
    stream = BinLogStreamReader(
        connection_settings = mysql_settings,
        server_id=9999,
        log_file=binlog_file,
        log_pos=start_position,
        resume_stream=True,
        blocking=False
    )

    for binlogevent in stream:
        data = {}
        if binlogevent.packet.log_pos >= stop_position:
            break

        # 当输出 "@timestamp" : binlogevent.timestamp
        # 即 "@timestamp" => 1582624830
        # logstash 会有warning
        # [WARN ] 2020-02-25 18:00:31.313 [[main]<stdin] Event - Unrecognized @timestamp value type=class org.jruby.RubyFixnum
        # 所以需要进行下面的格式转换
        # 使用 datetime.fromtimestamp 将解析为 当前操作系统时区的 datetime
        if isinstance(binlogevent, WriteRowsEvent):
            data = {
                "schema" : binlogevent.schema,
                "table" : binlogevent.table,
                "dmltype" : "insert",
                "@timestamp" :datetime.fromtimestamp(binlogevent.timestamp).strftime('%Y-%m-%dT%H:%M:%S') ,
            }
            print json.dumps(data)
        elif isinstance(binlogevent, DeleteRowsEvent):
            data = {
                "schema" : binlogevent.schema,
                "table" : binlogevent.table,
                "dmltype" : "delete",
                "@timestamp" :datetime.fromtimestamp(binlogevent.timestamp).strftime('%Y-%m-%dT%H:%M:%S') ,
            }
            print json.dumps(data)
        elif isinstance(binlogevent, UpdateRowsEvent):
            data = {
                "schema" : binlogevent.schema,
                "table" : binlogevent.table,
                "dmltype" : "update",
                "@timestamp" :datetime.fromtimestamp(binlogevent.timestamp).strftime('%Y-%m-%dT%H:%M:%S') ,
            }
            print json.dumps(data)
        elif isinstance(binlogevent, RotateEvent):
            if binlogevent.packet.log_pos <= 1655:
                logger.debug( u"next_binlog:" + binlogevent.next_binlog )

    stream.close()
我们在kibana里面把时间缩短到秒级看看这段时间的DML趋势
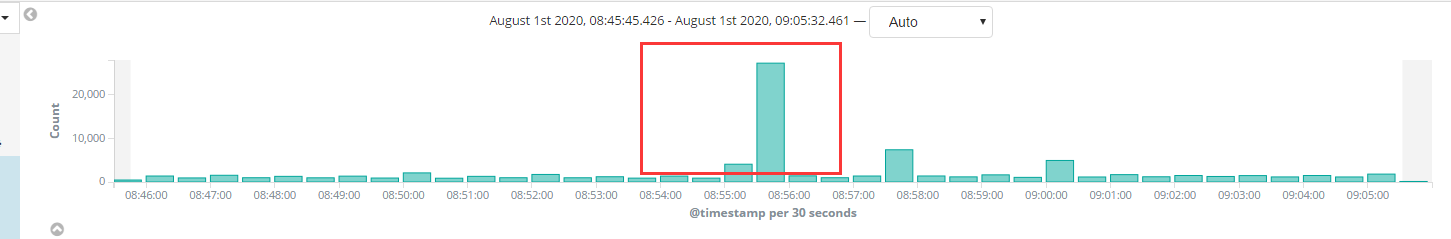
可以看见和我们直接分析binlog得到的结果一致,就是这个时间点的几个大事务导致的大量的数据更新。由于innodb_page_cleaners参数已经是4,不做调整。
总结:
1.杜绝大事务,同时注意SQL是否合理利用索引
2.mysql相关参数调整,比如innodb_io_capacity,innodb_io_capacity_max,由于这台机器使用的NVME接口的SSD,故把innodb_io_capacity参数调整到10000

 浙公网安备 33010602011771号