TensorFlow 2.0 教程23:用Estimator构造Boosted trees
本教程是使用决策树和tf.estimator API训练Gradient Boosting模型的端到端演练。 Boosted Trees模型是回归和分类中最受欢迎和最有效的机器学习方法之一。 这是一种集合技术,它结合了几种树模型的预测。
Boosted Trees模型受到许多机器学习从业者的欢迎,因为它们可以通过最小的超参数调整实现令人印象深刻的性能。
1.加载泰坦尼克数据集
from __future__ import absolute_import, division, print_function
import numpy as np
import pandas as pd
from IPython.display import clear_output
# Load dataset.
dftrain = pd.read_csv('https://storage.googleapis.com/tf-datasets/titanic/train.csv')
dfeval = pd.read_csv('https://storage.googleapis.com/tf-datasets/titanic/eval.csv')
y_train = dftrain.pop('survived')
y_eval = dfeval.pop('survived')
import tensorflow as tf
tf.random.set_seed(123)
数据集由训练集和评估集组成:
dftrain和y_train是training set - 模型用来学习的数据。
模型根据eval set,dfeval和y_eval进行测试。
数据集设定的特征如下:
Feature Name Description
sex Gender of passenger
age Age of passenger
n_siblings_spouses # siblings and partners aboard
parch # of parents and children aboard
fare Fare passenger paid.
class Passenger's class on ship
deck Which deck passenger was on
embark_town Which town passenger embarked from
alone If passenger was alone
2.探索数据
dftrain.head()
sex age n_siblings_spouses parch fare class deck embark_town alone
0 male 22.0 1 0 7.2500 Third unknown Southampton n
1 female 38.0 1 0 71.2833 First C Cherbourg n
2 female 26.0 0 0 7.9250 Third unknown Southampton y
3 female 35.0 1 0 53.1000 First C Southampton n
4 male 28.0 0 0 8.4583 Third unknown Queenstown y
dftrain.describe()
age n_siblings_spouses parch fare
count 627.000000 627.000000 627.000000 627.000000
mean 29.631308 0.545455 0.379585 34.385399
std 12.511818 1.151090 0.792999 54.597730
min 0.750000 0.000000 0.000000 0.000000
25% 23.000000 0.000000 0.000000 7.895800
50% 28.000000 0.000000 0.000000 15.045800
75% 35.000000 1.000000 0.000000 31.387500
max 80.000000 8.000000 5.000000 512.329200
dftrain.shape[0], dfeval.shape[0] # 训练集,验证集数量
(627, 264)
# 年龄分布
dftrain.age.hist(bins=20)
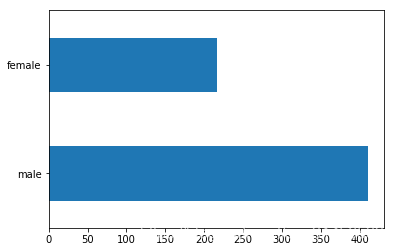
# 男女比例
dftrain.sex.value_counts().plot(kind='barh')
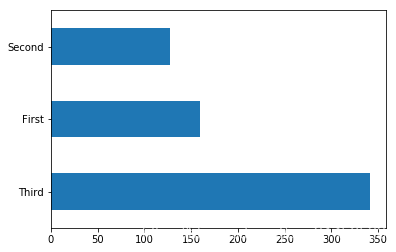
# 大部分为三等顾客
dftrain['class'].value_counts().plot(kind='barh')
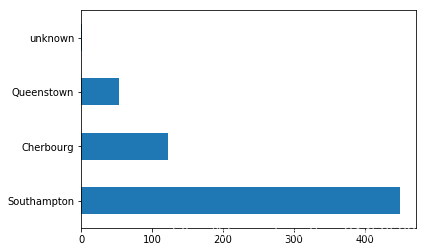
# 大多数乘客从南安普敦出发。
dftrain['embark_town'].value_counts().plot(kind='barh');
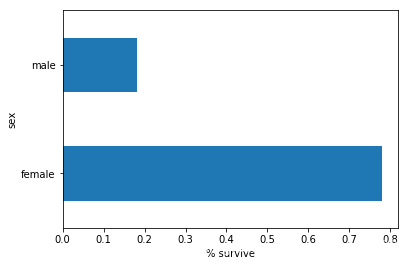
# 与男性相比,女性存活的机率要高得多。 这显然是该模型的预测特征
pd.concat([dftrain, y_train], axis=1).groupby('sex').survived.mean().plot(kind='barh').set_xlabel('% survive')
Text(0.5, 0, '% survive')
3.构造输入特征
fc = tf.feature_column
CATEGORICAL_COLUMNS = ['sex', 'n_siblings_spouses', 'parch', 'class', 'deck',
'embark_town', 'alone']
NUMERIC_COLUMNS = ['age', 'fare']
def one_hot_cat_column(feature_name, vocab):
return tf.feature_column.indicator_column(
tf.feature_column.categorical_column_with_vocabulary_list(feature_name,
vocab))
feature_columns = []
for feature_name in CATEGORICAL_COLUMNS:
# Need to one-hot encode categorical features.
vocabulary = dftrain[feature_name].unique()
feature_columns.append(one_hot_cat_column(feature_name, vocabulary))
for feature_name in NUMERIC_COLUMNS:
feature_columns.append(tf.feature_column.numeric_column(feature_name,
dtype=tf.float32))
可以查看要素列生成的转换。 例如,以下是在单个示例中使用indicator_column时的输出:
example = dict(dftrain.head(1))
class_fc = tf.feature_column.indicator_column(tf.feature_column.categorical_column_with_vocabulary_list('class', ('First', 'Second', 'Third')))
print('Feature value: "{}"'.format(example['class'].iloc[0]))
print('One-hot encoded: ', tf.keras.layers.DenseFeatures([class_fc])(example).numpy())
Feature value: "Third"
WARNING: Logging before flag parsing goes to stderr.
W0331 19:59:16.792093 140069985818368 deprecation.py:323] From /home/czy/anaconda3/envs/tf2_0/lib/python3.6/site-packages/tensorflow/python/ops/lookup_ops.py:1347: to_int64 (from tensorflow.python.ops.math_ops) is deprecated and will be removed in a future version.
Instructions for updating:
Use `tf.cast` instead.
W0331 19:59:16.879169 140069985818368 deprecation.py:323] From /home/czy/anaconda3/envs/tf2_0/lib/python3.6/site-packages/tensorflow/python/feature_column/feature_column_v2.py:4307: IndicatorColumn._variable_shape (from tensorflow.python.feature_column.feature_column_v2) is deprecated and will be removed in a future version.
Instructions for updating:
The old _FeatureColumn APIs are being deprecated. Please use the new FeatureColumn APIs instead.
W0331 19:59:16.880531 140069985818368 deprecation.py:323] From /home/czy/anaconda3/envs/tf2_0/lib/python3.6/site-packages/tensorflow/python/feature_column/feature_column_v2.py:4362: VocabularyListCategoricalColumn._num_buckets (from tensorflow.python.feature_column.feature_column_v2) is deprecated and will be removed in a future version.
Instructions for updating:
The old _FeatureColumn APIs are being deprecated. Please use the new FeatureColumn APIs instead.
One-hot encoded: [[0. 0. 1.]]
可以一起查看所有要素列转换:
tf.keras.layers.DenseFeatures(feature_columns)(example).numpy()
W0331 20:00:18.112254 140069985818368 deprecation.py:323] From /home/czy/anaconda3/envs/tf2_0/lib/python3.6/site-packages/tensorflow/python/feature_column/feature_column_v2.py:2758: to_float (from tensorflow.python.ops.math_ops) is deprecated and will be removed in a future version.
Instructions for updating:
Use `tf.cast` instead.
array([[22. , 1. , 0. , 1. , 0. , 0. , 1. , 0. , 0. ,
0. , 0. , 0. , 0. , 0. , 1. , 0. , 0. , 0. ,
7.25, 1. , 0. , 0. , 0. , 0. , 0. , 0. , 1. ,
0. , 0. , 0. , 0. , 0. , 1. , 0. ]], dtype=float32)
接下来,需要创建输入函数。 这些将指定如何将数据读入我们的模型以进行训练和推理。 我们使用tf.data
API中的from_tensor_slices方法直接从Pandas读取数据。 这适用于较小的内存数据集。 对于较大的数据集,tf.data API支持各种文件格式(包括csv)
# Use entire batch since this is such a small dataset.
NUM_EXAMPLES = len(y_train)
def make_input_fn(X, y, n_epochs=None, shuffle=True):
def input_fn():
dataset = tf.data.Dataset.from_tensor_slices((dict(X), y))
if shuffle:
dataset = dataset.shuffle(NUM_EXAMPLES)
# For training, cycle thru dataset as many times as need (n_epochs=None).
dataset = dataset.repeat(n_epochs)
# In memory training doesn't use batching.
dataset = dataset.batch(NUM_EXAMPLES)
return dataset
return input_fn
# Training and evaluation input functions.
train_input_fn = make_input_fn(dftrain, y_train)
eval_input_fn = make_input_fn(dfeval, y_eval, shuffle=False, n_epochs=1)
4.训练和验证模型
在训练Boosted Trees模型之前,让我们首先训练一个线性分类器(逻辑回归模型)。 最好的做法是从更简单的模型开始建立基准。
linear_est = tf.estimator.LinearClassifier(feature_columns)
# Train model.
linear_est.train(train_input_fn, max_steps=100)
# Evaluation.
result = linear_est.evaluate(eval_input_fn)
clear_output()
print(pd.Series(result))
accuracy 0.765152
accuracy_baseline 0.625000
auc 0.832844
auc_precision_recall 0.789631
average_loss 0.478908
label/mean 0.375000
loss 0.478908
precision 0.703297
prediction/mean 0.350790
recall 0.646465
global_step 100.000000
dtype: float64无锡人流多少钱 http://www.bhnnk120.com/
接下来让我们训练一下Boosted Trees模型。 对于增强树,支持回归(BoostedTreesRegressor)和分类(BoostedTreesClassifier)。 由于目标是预测一个类,所以我们使用BoostedTreesClassifier。
# Since data fits into memory, use entire dataset per layer. It will be faster.
# Above one batch is defined as the entire dataset.
n_batches = 1
est = tf.estimator.BoostedTreesClassifier(feature_columns,
n_batches_per_layer=n_batches)
# The model will stop training once the specified number of trees is built, not
# based on the number of steps.
est.train(train_input_fn, max_steps=100)
# Eval.
result = est.evaluate(eval_input_fn)
clear_output()
print(pd.Series(result))
accuracy 0.829545
accuracy_baseline 0.625000
auc 0.873003
auc_precision_recall 0.858218
average_loss 0.410594
label/mean 0.375000
loss 0.410594
precision 0.793478
prediction/mean 0.381616
recall 0.737374
global_step 100.000000
dtype: float64
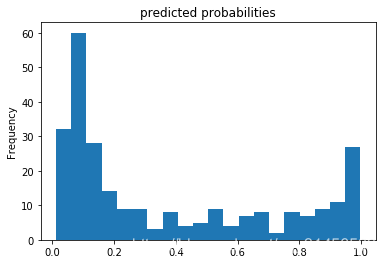
用训练好的模型进行预测
pred_dicts = list(est.predict(eval_input_fn))
probs = pd.Series([pred['probabilities'][1] for pred in pred_dicts])
probs.plot(kind='hist', bins=20, title='predicted probabilities')
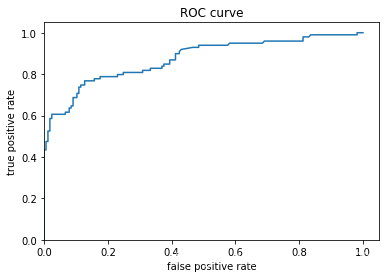
观察roc得分
from sklearn.metrics import roc_curve
from matplotlib import pyplot as plt
fpr, tpr, _ = roc_curve(y_eval, probs)
plt.plot(fpr, tpr)
plt.title('ROC curve')
plt.xlabel('false positive rate')
plt.ylabel('true positive rate')
plt.xlim(0,)
plt.ylim(0,);

 浙公网安备 33010602011771号