
d3.js 绘制Lollipop plot(棒棒糖图)
棒棒糖图与普通的条形图功能相似。从图形上来看,棒棒糖图是由一条锚定在x轴或y轴上的线和点组成的。使用d3js绘制棒棒糖图很简单,因此这次为了学习d3js的一些方法,使用按钮动态改变棒棒糖图。效果如下:
图1:Value1的结果
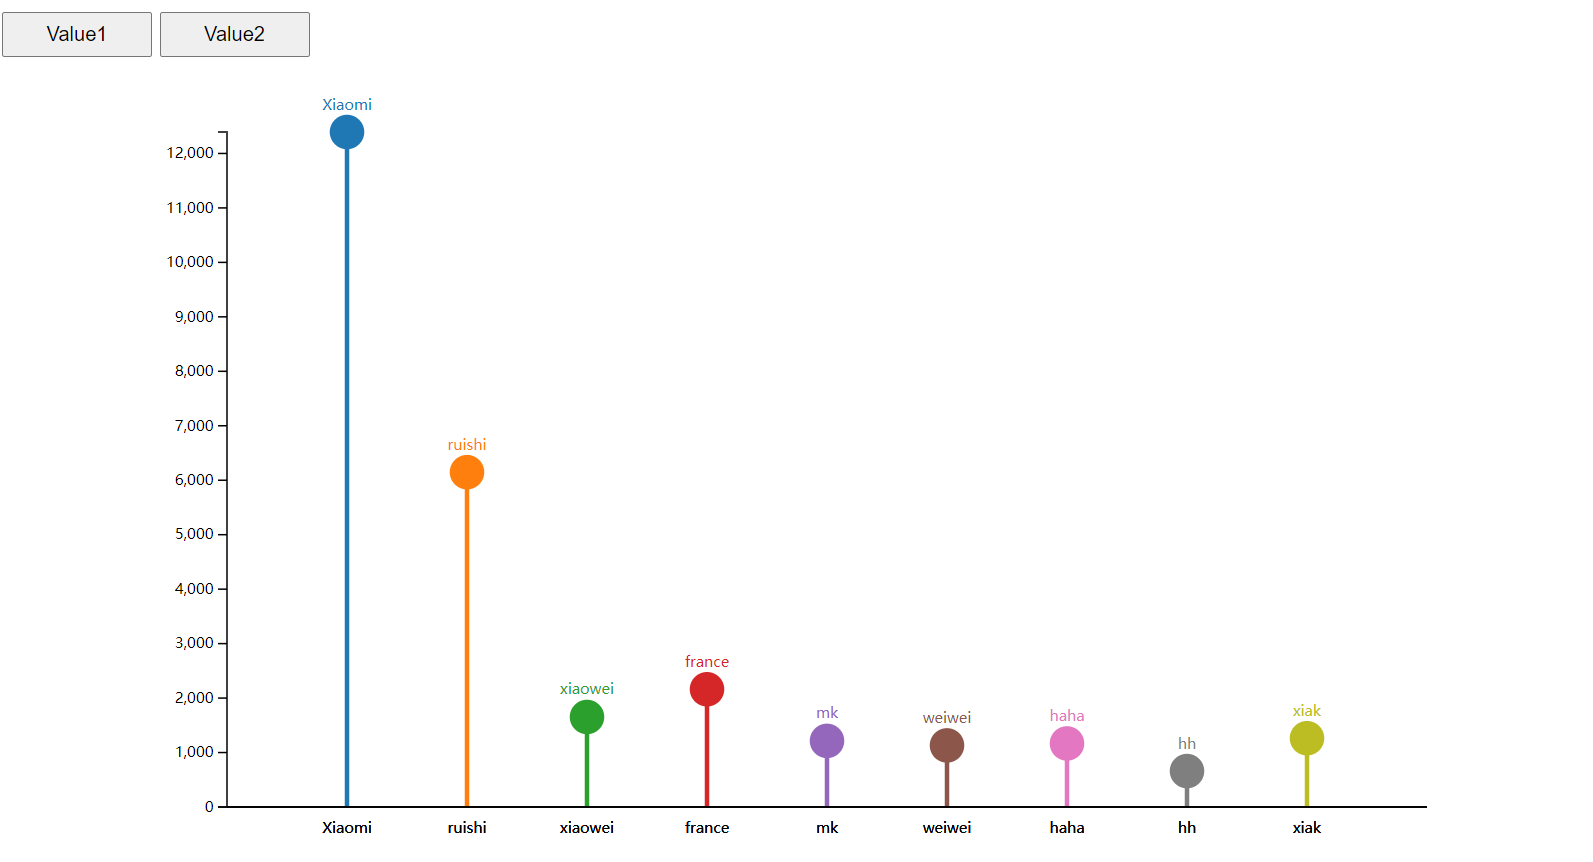
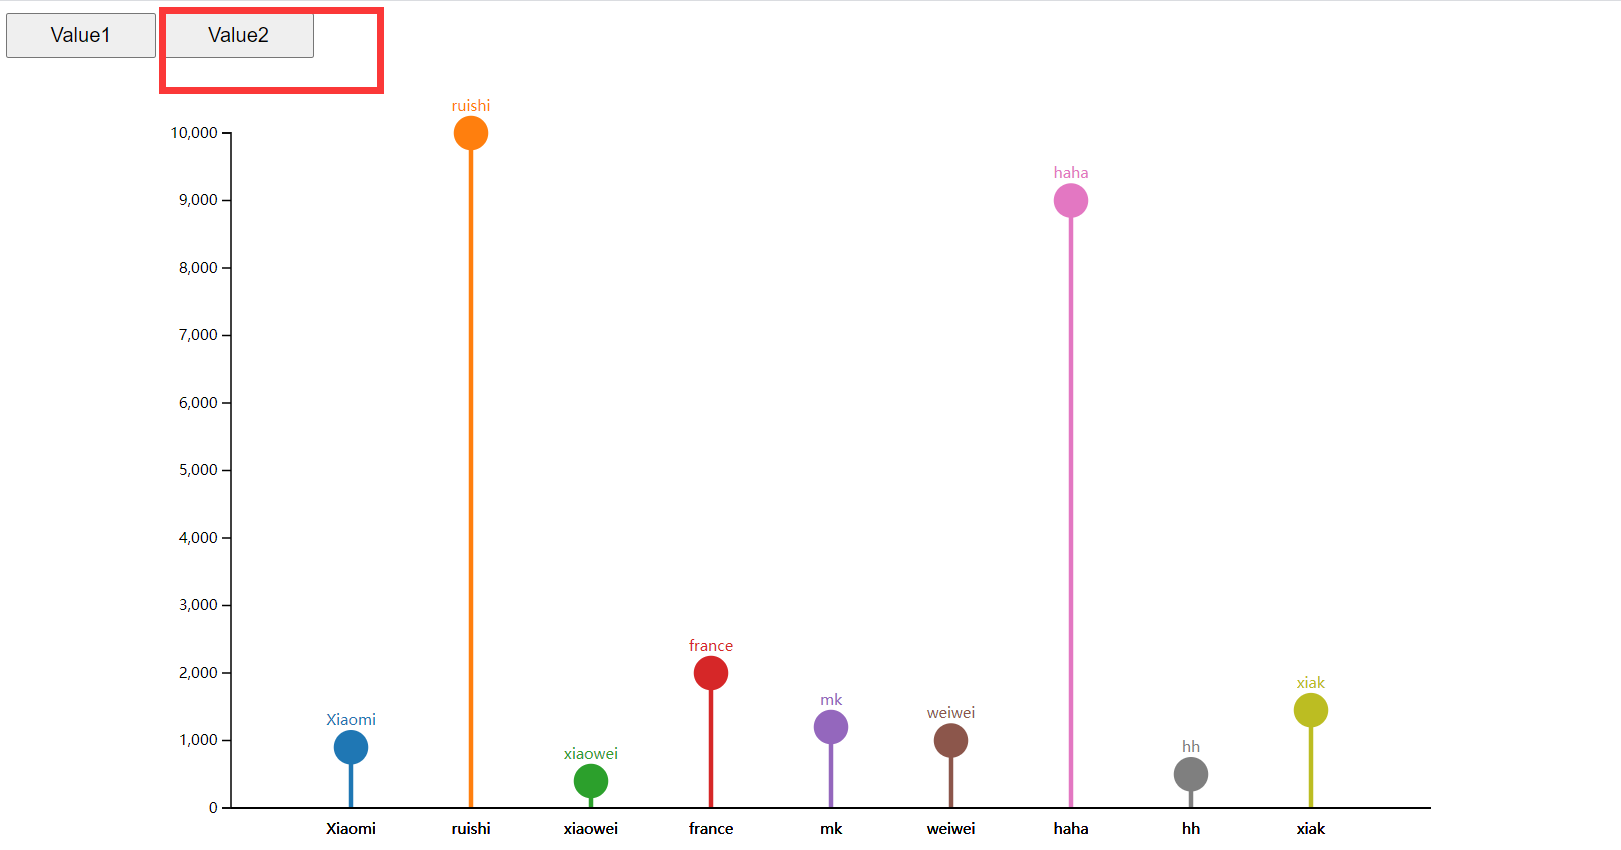
图2:Value2的结果
一、准备数据
是一个csv数据

role,Value1,Value2
Xiaomi,12394,900
ruishi,6148,10000
xiaowei,1653,400
france,2162,2000
mk,1214,1200
weiwei,1131,1000
haha,1167,9000
hh,660,500
xiak,1263,1450
二、绘图代码
1、LollipopChartPlot.html文件
<!DOCTYPE html>
<html lang="en">
    <head>
        <meta charset="UTF-8">
        <meta http-equiv="X-UA-Compatible" content="IE=edge">
        <meta name="viewport" content="width=device-width, initial-scale=1.0">
        <title>Lollipop plot --- 棒棒糖图</title>
        <!-- <link ref="stylesheet" href="./index.css"></link> -->
        <script src="../../../d3.min.js"></script>
        <style>
            #selectButton button {
                width: 100px;
                height: 30px;
                margin-right: 5px;
            }
        </style>

    </head>
    <body>
        <div id="selectButton"></div>
        <div class="lollipop" id="lollipop"></div>
    </body>
    <script type="module" src="./lollipop.js"></script>
    <!-- Uncaught SyntaxError: Cannot use import statement outside a module -->
</html>
2、lollipop.js文件
// 定义按钮
export const changeValueButton = (selection, options) => {
    let { value, onButtonClicked } = options;
    // selectButton
    let button = selection.selectAll('button')
        .data(value);
    // button.exit().remove()
    button = button
        .enter()
        .append('button')
        .merge(button)
        .attr('id', value)
        .attr('value', d=>d)
        .text(d=>d)
        .on('click', function() {
            // console.log('tttt', this.value)
            onButtonClicked(this.value);
        })

}

// 1、create dimensions
const dms = {
    width: 1000,
    height: 550,
    margin: {
        top: 50,
        left: 150,
        bottom: 50,
        right: 50
    }
}
dms.innerWidth = dms.width - dms.margin.left - dms.margin.right;
dms.innerHeight = dms.height - dms.margin.top - dms.margin.bottom;

const svg = d3.select('#lollipop')
    .append('svg')
    .attr('width', dms.width)
    .attr('height', dms.height);

const maingroup = svg.append('g')
    .attr('transform', `translate(${dms.margin.left}, ${dms.margin.top})`);
// 绘图区域
const lollipopArea = maingroup.append('g')
    .attr('class', 'lollipop-area');
let path = '../data/7_OneCatOneNum_header.csv';
// let yValue = d => +d.Value1;
let xValue = d => d.role;
let yVal = 'Value1'; // y默认选择第一个值
let data;
let yScale = d3.scaleLinear()
    .range([dms.innerHeight, 0])
    .nice();
let yAxisG = maingroup.append('g')
    .attr('class', 'y-axis');

function render() {
    // add button
    const button = d3.select('#selectButton');
    // let options = {value: 'Value1'};
    // changeValueButton(button, options); // 等价于下面的方式
    button.call(changeValueButton, {
        value: ['Value1', 'Value2'],
        onButtonClicked: onButtonSelectionClicked
    })

    let yValue = d=> +d[yVal];
    let transition = d3.transition().duration(2000).ease(d3.easeLinear);

    let xScale = d3.scaleBand()
        .domain(data.map(xValue))
        .range([0, dms.innerWidth]).padding(1);

    // yScale.domain(d3.extent(data, yValue));
    yScale.domain([0, d3.max(data, yValue)]);
    // console.log('yScale', yScale(-900), yScale.domain(), yScale.range())
    yAxisG
        .transition().duration(1000)
        .call(d3.axisLeft(yScale));

    let colorScale = d3.scaleOrdinal()
        .domain(data.map(xValue))
        .range(d3.schemeCategory10)

   // render data
   // 1、line
   const lines = lollipopArea.selectAll('line')
    .data(data);

    const linesEnter = lines
        .enter().append('line')
        .attr('fill', d=>colorScale(xValue(d)))
        .attr('stroke', d=>colorScale(xValue(d)))
        .attr('stroke-width', 3)
        .attr('x1', d=>xScale(xValue(d)))
        .attr('y1', dms.innerHeight)
        .attr('x2', d=>xScale(xValue(d)))
        // .attr('y2', d=>yScale(yValue(d)))
        .merge(lines)
        .transition(transition)
        .attr('y2', d=>yScale(yValue(d)));

    // 2、circles
   const circles = lollipopArea.selectAll('circle')
   .data(data);

   const circlesEnter = circles
       .enter().append('circle')
       .attr('fill', d=>colorScale(xValue(d)))
       .attr('stroke', d=>colorScale(xValue(d)))
       .attr('stroke-width', 3)
       .attr('cx', d=>xScale(xValue(d)))
       .merge(circles)
       .attr('r', 5)
       .transition(transition)
       .attr('cy', d=>yScale(yValue(d)))
       .attr('r', 10);

    // 3、texts
   const texts = lollipopArea.selectAll('text')
   .data(data);

   const textsEnter = texts
       .enter().append('text')
       .attr('fill', d=>colorScale(xValue(d)))
       .attr('font-size', '10px')
       .attr('text-anchor', 'middle')
       .attr('x', d=>xScale(xValue(d)))
    //    .attr('y', d=>yScale(yValue(d)) - 15)
       .merge(texts)
       .transition(transition)
       .attr('y', d=>yScale(yValue(d)) - 15)
       .text(d=>xValue(d))
  // x轴
    const xAxis = d3.axisBottom(xScale)
        .tickSize(0)
        .tickPadding(10);
    const xAxisG = maingroup.append('g')
        .attr('class', 'y-axis')
        .attr('transform', `translate(0, ${dms.innerHeight})`)
        .call(xAxis);
}

const onButtonSelectionClicked = buttonVal => {
    // console.log('button', buttonVal);
    yVal = buttonVal;
    render()
}
// 读取文件
d3.csv(path).then(loadData => {
    // console.log(data);
    data = loadData;
    render();
});
至此,棒棒糖图绘制完成,此图比较简单,但是也包含了比较重要的d3.js功能,比如,动态改变数据和按钮功能的使用。因此,记录下来,方便参考功能。


【推荐】国内首个AI IDE,深度理解中文开发场景,立即下载体验Trae
【推荐】编程新体验,更懂你的AI,立即体验豆包MarsCode编程助手
【推荐】抖音旗下AI助手豆包,你的智能百科全书,全免费不限次数
【推荐】轻量又高性能的 SSH 工具 IShell:AI 加持,快人一步
· TypeScript + Deepseek 打造卜卦网站:技术与玄学的结合
· Manus的开源复刻OpenManus初探
· AI 智能体引爆开源社区「GitHub 热点速览」
· 三行代码完成国际化适配,妙~啊~
· .NET Core 中如何实现缓存的预热?