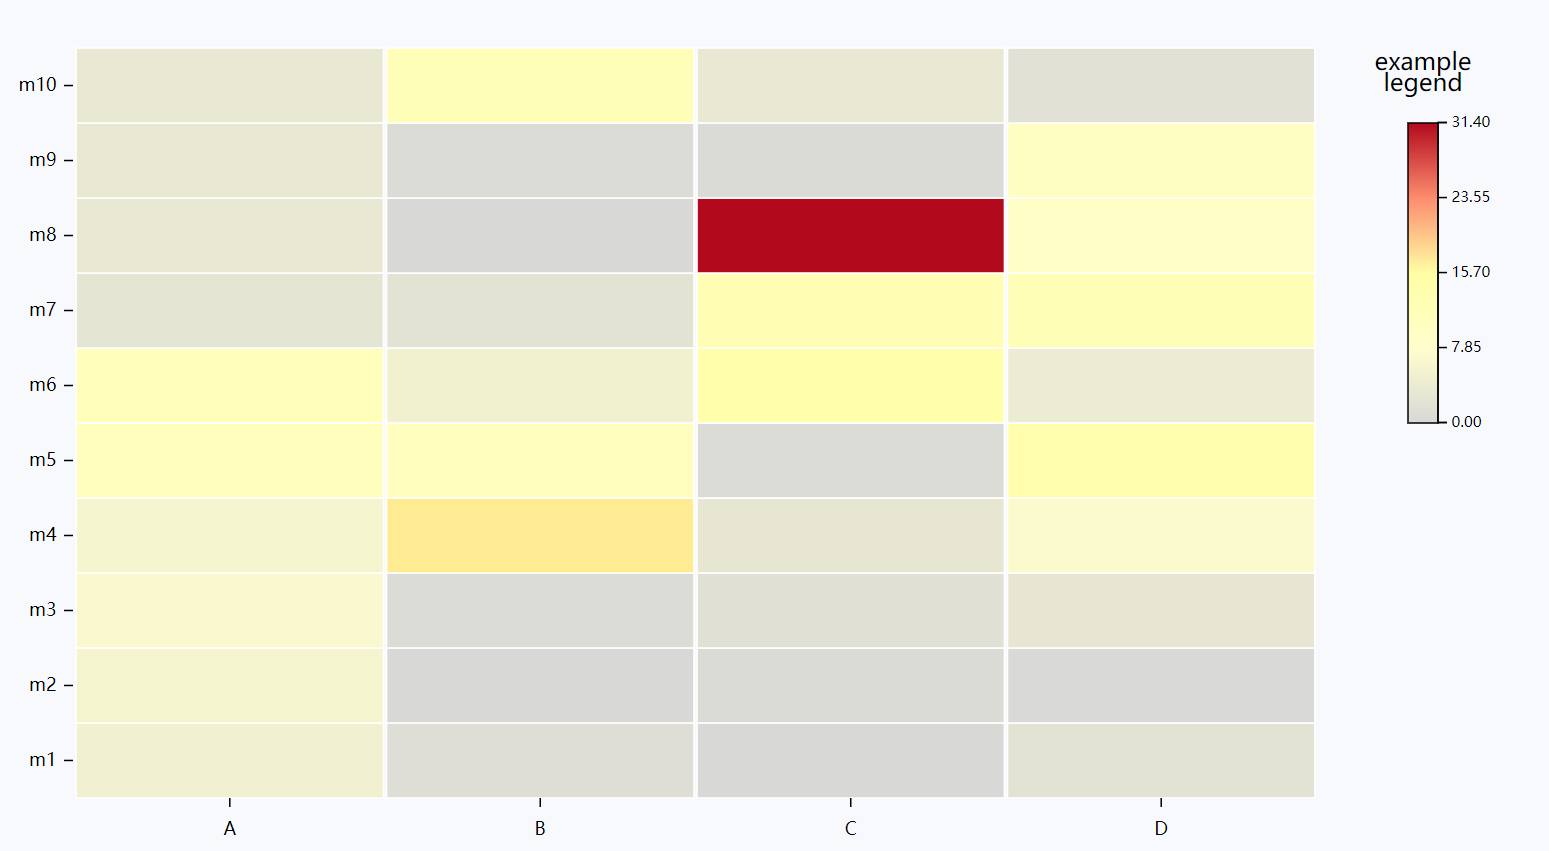
d3js实现热图--heatmap
这一章节记录热图,下面是图和实现过程。

1、data
这些数据存储在csv文件中
x,y,value
A,m1,5
A,m2,5.7
A,m3,6.6
A,m4,5.9
A,m5,10.8
A,m6,11.5
A,m7,2.6
A,m8,3.4
A,m9,3.4
A,m10,3.4
B,m1,1.2
B,m2,0
B,m3,0.9
B,m4,17.1
B,m5,10.6
B,m6,5.11
B,m7,2.2
B,m8,0
B,m9,0.9
B,m10,11.9
C,m1,0
C,m2,0.7
C,m3,1.6
C,m4,2.9
C,m5,0.8
C,m6,14.5
C,m7,12.6
C,m8,31.4
C,m9,0.4
C,m10,3.4
D,m1,2.2
D,m2,0.3
D,m3,2.9
D,m4,7.1
D,m5,13.6
D,m6,4.11
D,m7,12.2
D,m8,9
D,m9,9.9
D,m10,1.9
2、load data
d3.csv('data.csv').then(data => {
       data.forEach(d => {
           d.value = +(d.value); // 转成数值
       });
       drawHeatmap(data);
});
function drawHeatmap(data) {
    this.heatmapData = data;
let myXValue = [...new Set(data.map(d=>{return d.x;}))];
let myYValue = [...new Set(data.map(d=>{return d.y;}))];
   // 下面步骤为此函数里面的具体代码
}
3、create dimensions and compute data
const dms = {
      width: 1080,
      height: 600,
      margin: {
         top: 50,
         right: 50,
         bottom: 50,
         left: 50
       },
       legend: {
          yStart: 50
       },
        rightMargin: 150,
  };
 dms.innerWidth = dms.width - dms.margin.left - dms.margin.right - dms.rightMargin;
 dms.innerHeight = dms.height - dms.margin.top - dms.margin.bottom;

  const minLegend = d3.min(this.heatmapData, d =>d.value);
  const maxLegend = d3.max(this.heatmapData, d => d.value);
  const sumMinMaxLegend =
    d3.max(this.heatmapData, d => d.value) +
    d3.min(this.heatmapData, d =>d.value);
4、draw canvas
 const mainsvg = d3.select('#heatmapLine')
                .append('svg')
                .attr('width', dms.width)
                .attr('height', dms.height)
                .attr('id', 'mainsvg')
                .style('background', '#f8f9fd');

 const maingroup = mainsvg.append('g')
                .attr('transform', `translate(${dms.margin.left}, ${dms.margin.top})`);

 const hearmapArea = maingroup.append('g');
5、create scale
const xScale = d3.scaleBand()
                .domain(myXValue)
                .range([0, dms.innerWidth])
                .padding(0.01);

const yScale = d3.scaleBand()
                .domain(myYValue)
                .range([dms.innerHeight, 0])
                .padding(0.001);

const colorScale = d3.scaleLinear()
                .domain([
                    minLegend,
                    (sumMinMaxLegend / 2 + minLegend) /2,
                    sumMinMaxLegend / 2,
                    (sumMinMaxLegend / 2 + maxLegend) /2,
                    maxLegend
                ])
                .range(["#D8D8D7", "rgb(255,254,204)", 'rgb(255,254,164)', "#FD8C6F",
                    "rgb(178,10,28)"])
                .interpolate(d3.interpolateHcl);
6、draw data
hearmapArea.selectAll('rect')
                .data(this.heatmapData)
                .join('rect')
                .attr('x', d=>xScale(d.x))
                .attr('y', d=>yScale(d.y))
                .attr('rx', 0)
                .attr('ry', 0)
                .attr('width', xScale.bandwidth())
                .attr('height', yScale.bandwidth())
                .attr('fill', d=>colorScale(d.value))
                .style('stroke-width', 1)
                .style('stroke', '#fff')
                .style('opacity', 1)
7、create axes
const xAxis = d3.axisBottom(xScale)
                .tickPadding(10) // 设置tick label与坐标轴的的距离
                .tickValues(myXValue.map(function (d) {return d;}));
            // .tickSize(0); // 去除刻度
const yAxis = d3.axisLeft(yScale)
                .tickPadding(5);
            // .tickSize(0);

hearmapArea.append('g')
                .style('font-size', '12px')
                .attr('class', 'x-axis')
                .call(xAxis)
                .attr('transform', `translate(0, ${dms.innerHeight})`)
                .select('.domain').remove(); // 去除坐标轴线

hearmapArea.append('g')
                .style('font-size', '12px')
                .attr('class', 'y-axis')
                .call(yAxis)
                .select('.domain').remove();
8、create legend
const linearGradiant = maingroup.append('linearGradient')
.attr('id', 'linear-gradient');
linearGradiant
.attr('y2', '0')
.attr('x1', '0')
.attr('y1', '1')
.attr('x2', '0');
linearGradiant
.selectAll("stop")
.data([
{ offset: "0%", color: "#D8D8D7" },
{ offset: "25%", color: "rgb(255,254,204)" },
{ offset: "50%", color: 'rgb(255,254,164)' },
{ offset: "75%", color: "#FD8C6F" },
{ offset: "100%", color: "rgb(178,10,28)" },
])
.enter()
.append("stop")
.attr("offset", function (d) {
return d.offset;
})
.attr("stop-color", function (d) {
return d.color;
});
const legendWidth = 20;
const legendHeight = 200;
const legendgroup = maingroup.append('g')
.attr('id', 'legend')
.attr('transform', `translate(${dms.innerWidth + 50}, 0)`);
legendgroup.append('rect')
.attr('class', 'legendRect')
.attr('x', 10)
.attr('y', dms.legend.yStart)
.attr('width', legendWidth)
.attr('height', legendHeight)
.attr('fill', 'url(#linear-gradient)')
.style("stroke", "black")
.style("stroke-width", "1px");
// 添加图例标题const legendTitle = legendgroup.append('text');
let arr = [];
let title = 'example<br>legend';
legendTitle
.each(function () {
arr = title.split('<br>');
arr.forEach((item, index) => {
d3.select(this)
.append('tspan')
.text(item)
.attr('dy', arr.length <= 2 ? '0.9em' : (index ? '1.1em' : 0))
.attr('x', 20)
.attr("text-anchor", "middle")
.attr("class", "tspan" + index);
});
});
const legendScale = d3.scaleLinear()
.domain(d3.extent(this.heatmapData, d=>d.value))
.range([legendHeight, 0]);
// 添加图例尺度
const legendxAxis = d3.axisRight(legendScale)
.tickValues([
minLegend,
(sumMinMaxLegend / 2 + minLegend) /2,
sumMinMaxLegend / 2,
(sumMinMaxLegend / 2 + maxLegend) /2,
maxLegend
])
// .tickFormat(d=>toCeil(d, 2));
.tickFormat(d=>d.toFixed(2));
// .ticks(5);
legendgroup.append('g')
.call(legendxAxis)
.attr('class', 'legend-axis')
.attr('transform', `translate(${legendWidth + 10}, ${dms.legend.yStart - 0.3})`);
至此,热图就完成了。
需要注意以下几点:
1、下面这段代码,颜色渐变是垂直方向的, y1和y2可以互换,只需颜色与图中相对应即可
linearGradiant
.attr('y2', '1')
.attr('x1', '0')
.attr('y1', '0')
.attr('x2', '0');
如果需要水平渐变,则需要改成下面代码
linearGradiant
.attr('y2', '0')
.attr('x1', '0')
.attr('y1', '0')
.attr('x2', '1');
2、颜色水平和垂直渐变也可添加%,
linearGradiant
.attr('y2', '100%')
.attr('x1', '0%')
.attr('y1', '0%')
.attr('x2', '0%');
但是若加%,svg转pdf时,没有渐变效果,因此此处去除了%


