使用d3js绘制箱线图(box plot)
转载请注明出处。
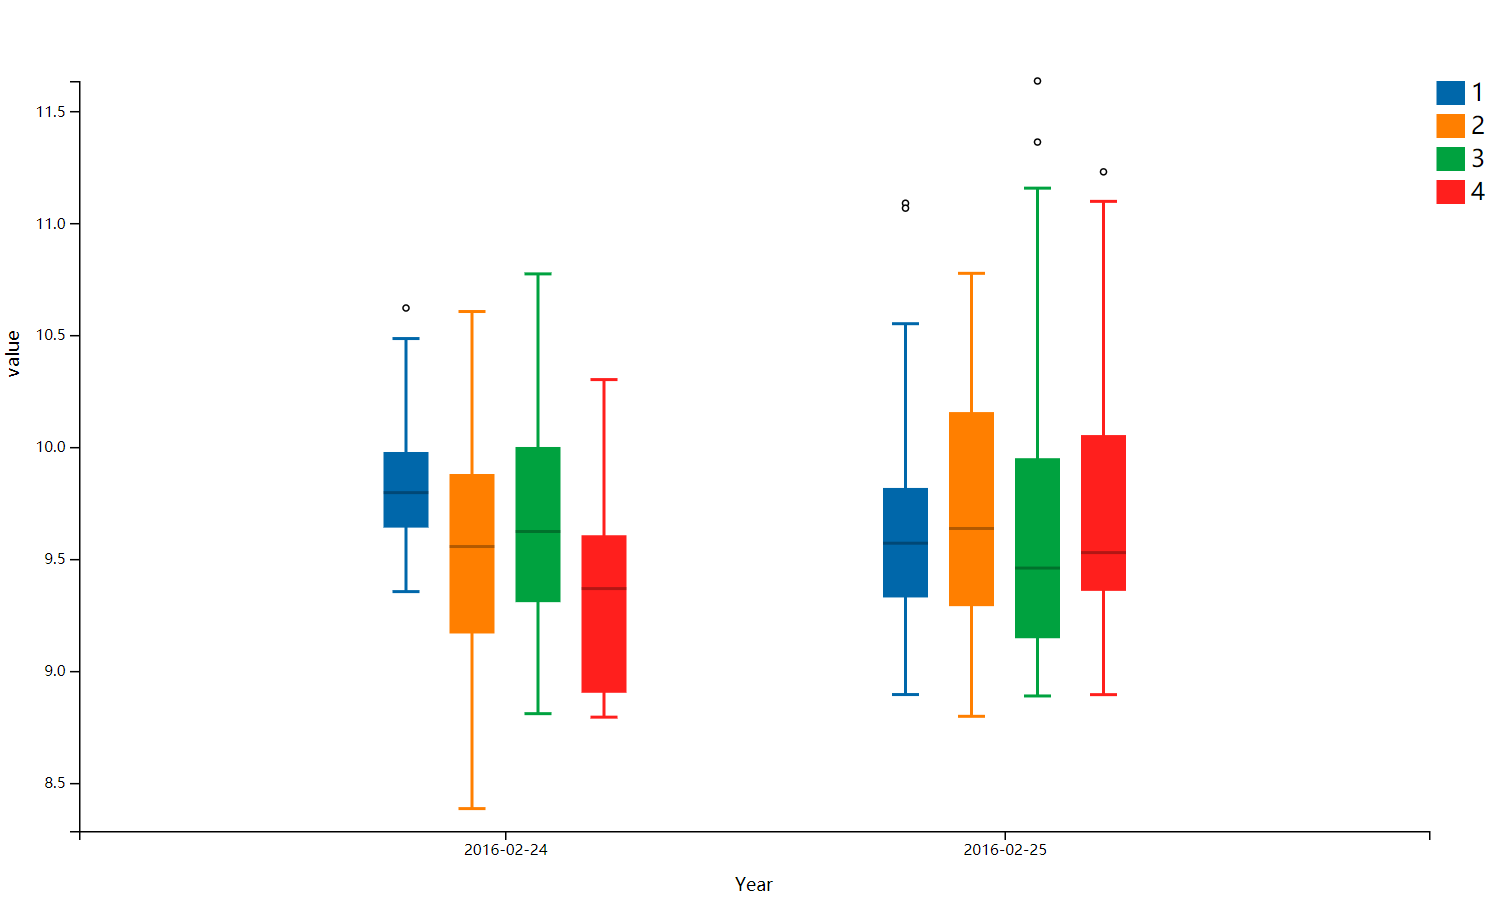
上一篇文章记录了dot-pie的绘制,这篇文章将会介绍另一种图形,箱线图。箱线图使用数据的最小值、最大值、中位数以及上下两个四分位数展现了这组数据。下面是最终绘制的图形。
1、data
const dataset = [
{
      "value": 1,
      "y": 9.6121,
      "x": "2016-02-24"
    },
    {
      "value": 2,
      "y": 8.3333,
      "x": "2016-02-24"
    },
    ......
]
这个数据并不能直接用于绘制箱线图,第三步骤中将对此数据进行处理。
2、create dimension、colors and tooltips
const dms = {
        width: 1000,
        height: 600,
        margin: {
            top: 50,
            right: 50,
            bottom: 50,
            left: 50
        },
        tooltipMargin: 10
    }

    dms.innerWidth = dms.width - dms.margin.left - dms.margin.right;
    dms.innerHeight = dms.height - dms.margin.top - dms.margin.bottom;

const colors = ["#0067AA", "#FF7F00", "#00A23F", "#FF1F1D",
                    "#A763AC", "#B45B5D", "#FF8AB6", "#B6B800"]
const Tooltip = d3.select('#tooltip')
.style('opacity', 0)
.style("background", "white")
.style("border", "1px solid #ddd")
.style("box-shadow", "2px 2px 3px 0px rgb(92 92 92 / 0.5)")
.style("font-size", ".8rem")
.style("padding", "2px 8px")
.style('font-weight', 600)
.style('position', 'absolute')
3、access data
// 排序
 dataset.sort((a,b ) => a.value - b.value);
// 获取值
const yearAccessor = d=>d.x;
const yAccessor = d => d.y;
const groupAccessor = d=>d.value;
// 分组
const dataByYearAndGroup = d3.nest()
.key(yearAccessor)
.key(groupAccessor)
.entries(dataset)
// 计算箱线图所需要的最大值、最小值、中位数以及上下四分位数,还有离散值
const dataByYearAndGroupWithStats = dataByYearAndGroup.map(year => {
const yearData = year['values'].map(group => {
const groupYValues = group.values.map(yAccessor).sort((a, b) => a - b)
const q1 = d3.quantile(groupYValues, 0.25)
const median = d3.median(groupYValues)
const q3 = d3.quantile(groupYValues, 0.75)
const iqr = q3 - q1
const [min, max] = d3.extent(groupYValues)
const rangeMin = d3.max([min, q1 - iqr * 1.5])
const rangeMax = d3.min([max, q3 + iqr * 1.5])
const outliers = group.values.filter(d => yAccessor(d) < rangeMin || yAccessor(d) > rangeMax)
return {
...group,
month: +group.key,
q1, median, q3, iqr, min, max, rangeMin, rangeMax, outliers
}
})
return {
...year,
values: yearData,
}
});
4、draw canvas
const mainsvg = d3.select('#group-box-plot')
                    .append('svg')
                    .attr('width', dms.width)
                    .attr('height', dms.height)
const maingroup = mainsvg.append('g')
                    .attr('transform', `translate(${dms.margin.left}, ${dms.margin.top})`)
const boxArea = maingroup.append('g')
其中,
<div class="group-box-plot" id="group-box-plot"></div>
<div id="tooltip"></div>
5、create scale
// 一级分组
const xScale = d3.scaleBand()
               .domain(dataByYearAndGroupWithStats.map(d=>d.key))
               .rangeRound([0, dms.innerWidth])
               .paddingInner(0.1)
               .paddingOuter(.4)
// 二级分组
const groupScale = d3.scaleBand()
                   .padding(1.9)
const groupKeys = dataByYearAndGroup[0]['values']
                  .map(d => {return d.key})
groupScale.domain(groupKeys).rangeRound([0, xScale.bandwidth()])

const yScale = d3.scaleLinear()
               .domain([d3.min(dataset, d=>d.y) - 0.1, d3.max(dataset, d=>d.y)])
               .range([dms.innerHeight, 0])
// 颜色
const colorScale = d3.scaleOrdinal()
.range(colors)
6、draw data
let binGroups = boxArea.selectAll('bin')
                      .data(dataByYearAndGroupWithStats)
binGroups.exit().remove()
const newBinGroups = binGroups
.enter()
.append("g")
.attr("class", "bin")
.attr('transform', d=>`translate(${xScale(d.key)}, 0)`)
binGroups = newBinGroups.merge(binGroups)
const boxWidth = 30, boxPadding = 6;
// 添加绘制区域与悬浮提示
const boxGroups = binGroups.selectAll('box')
              .data(d=>d.values)
.join('g')
.attr('class', 'box')
.on('mouseover', (event) => {
d3.select('#tooltip')
.style('opacity', 1)
.html(boxTooltip(event))
})
.on('mousemove', () => {
const event = d3.event;
// console.log(event.pageX, event.pageY)
Tooltip
.style('left', (event.pageX + dms.tooltipMargin) + 'px')
.style('top', (event.pageY + dms.tooltipMargin) + 'px')
})
.on('mouseout', () => {
d3.select('#tooltip').style('opacity', 0);
});
// 垂直的线
const rangeLines = boxGroups.append('line')
.attr('class', 'line1')
.attr('x1', d=>groupScale(d.key))
.attr('x2', d=>groupScale(d.key))
.attr('y1', d=>yScale(d.rangeMin))
.attr('y2', d=>yScale(d.rangeMax))
.style('width', 40)
.attr('stroke', d=>colorScale(d.key))
.attr("stroke-width", 2)
// 矩形(箱线图)
const barRects = boxGroups.append('rect')
.attr('x', d=>groupScale(d.key) - boxWidth/2)
.attr('y', d=>yScale(d.q3))
.attr('width', boxWidth)
.attr('height', d=>yScale(d.q1) - yScale(d.q3))
.attr('fill', d=>colorScale(d.key))
// 中值线
const mediansLine = boxGroups.append('line')
.attr('class', 'median')
.attr('x1', d=>groupScale(d.key) - boxWidth / 2)
.attr('x2', d=>groupScale(d.key) + boxWidth / 2)
.attr('y1', d=>yScale(d.median))
.attr('y2', d=>yScale(d.median))
.attr("stroke", 'black')
.style("width", 40)
.attr("stroke-width", 2)
.attr('opacity', 0.3)
// 最大垂直线两端横线
const rangeMins = boxGroups.append('line')
.attr('class', 'line')
.attr('x1', d=>groupScale(d.key) - boxWidth / 2 + boxPadding)
.attr('x2', d=>groupScale(d.key) + boxWidth / 2 - boxPadding)
.attr('y1', d=>yScale(d.rangeMin))
.attr('y2', d=>yScale(d.rangeMin))
.style("width", 40)
.attr('stroke', d=>colorScale(d.key))
.attr("stroke-width", 2)
const rangeMaxs = boxGroups.append('line')
.attr('class', 'line')
.attr('x1', d=>groupScale(d.key) - boxWidth / 2 + boxPadding)
.attr('x2', d=>groupScale(d.key) + boxWidth / 2 - boxPadding)
.attr('y1', d=>yScale(d.rangeMax))
.attr('y2', d=>yScale(d.rangeMax))
.style("width", 40)
.attr('stroke', d=>colorScale(d.key))
.attr("stroke-width", 2)
// 离散点
const outliers = boxGroups.append('g')
.attr("transform", d => `translate(${groupScale(d.key)}, 0)`)
.selectAll('circle')
.data(d=>d.outliers)
.join("circle")
.attr("class", "outlier")
.attr("cy", d => yScale(yAccessor(d)))
.attr("r", 2)
.attr('fill', '#ffffff')
.attr('stroke', 'black')
7、create axes
  //  设置y坐标轴
    const yAxis = d3.axisLeft(yScale)
        .ticks(5)

    const yAxisGroup = maingroup.append('g')
        .attr('class', 'y-axis')
        .call(yAxis)

    // 添加y轴label
    const yAxisLabel = yAxisGroup.append('text')
        .attr('class', 'axis-label')
        .attr('transform', `rotate(-90)`)
        .attr('x', -dms.innerHeight / 3)
        .attr('y', -dms.margin.left + 10)
        .html("value")
        .attr('fill', 'black')
        .attr('font-size', '12px')
  // 设置x坐标轴
    const labels = dataByYearAndGroup.map(d => { return d.key });
   const xAxis = d3.axisBottom(xScale)
            .tickFormat((d, i) => labels[i]);
   const xAxisGroup = maingroup.append('g')
                    .attr('class', 'x-axis')
                    .attr('transform', `translate(0, ${dms.innerHeight})`)
                     .call(xAxis)
  // 添加x轴label
  const xAxisLabel = xAxisGroup.append('text')
                    .attr('class', 'axis-label')
                    .attr('x', dms.innerWidth / 2)
                    .attr('y', 40)
                    .html("Year")
                    .attr('fill', 'black')
                    .attr('font-size', '12px')
8、create legend
  // 添加图例
    const legend = maingroup.append('g')
        .selectAll('g')
        .data(dataByYearAndGroupWithStats[0].values)
        .join('g')
        .attr('class', 'legend')
        .attr('transform', (d, i)=>`translate(0, ${i * 22})`)

    legend.append('rect')
        .attr('x', dms.innerWidth + 5)
        .attr('width', 19)
        .attr('height', 16)
        .attr('fill', d=>colorScale(d.key))

    legend.append('text')
        .attr('x', dms.innerWidth + 28)
        .attr('y', 8)
        .attr("dy", "0.32em")
        .text(d=>d.key)
到这一步骤,箱线图差不多完成了。
本章节,一并添加了悬浮提示功能,给出了每个箱线图的数据信息,包括最大值、最小值、中位数以及上下两个四分位数。需要说明的是,悬浮提示中的boxTooltip函数为:
function boxTooltip(d) {
    return  `
        <span class="label">group</span>: ${d.key}<br>
        <span class="label">max</span>: ${d.rangeMax}<br>
        <span class="label">q1</span>: ${d.q1}<br>
        <span class="label">median</span>: ${d.median}<br>
        <span class="label">q3</span>: ${d.q3}<br>
        <span class="label">min</span>: ${d.rangeMin}<br>
       `
}


【推荐】国内首个AI IDE,深度理解中文开发场景,立即下载体验Trae
【推荐】编程新体验,更懂你的AI,立即体验豆包MarsCode编程助手
【推荐】抖音旗下AI助手豆包,你的智能百科全书,全免费不限次数
【推荐】轻量又高性能的 SSH 工具 IShell:AI 加持,快人一步
· Manus爆火,是硬核还是营销?
· 终于写完轮子一部分:tcp代理 了,记录一下
· 别再用vector<bool>了!Google高级工程师:这可能是STL最大的设计失误
· 单元测试从入门到精通
· 震惊!C++程序真的从main开始吗?99%的程序员都答错了