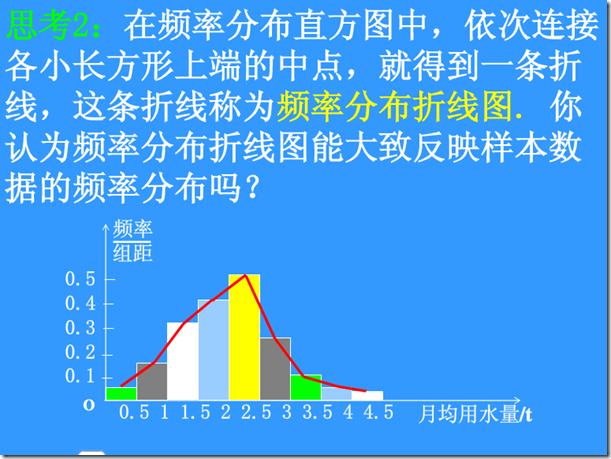
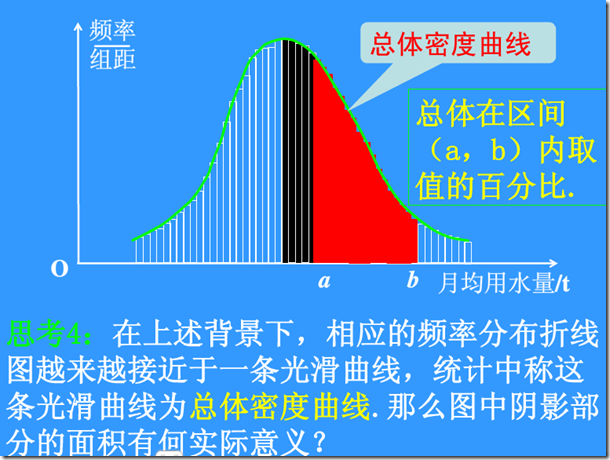
频率分布折线图与总体密度曲线
R语言举例

> x = c(29.6, 28.2, 19.6, 13.7, 13.0, 7.8, 3.4, 2.0, 1.9, 1.0, 0.7, 0.4, 0.4, 0.3, 0.3, 0.3, 0.3, 0.3, 0.2, 0.2, 0.2, 0.1, 0.1, 0.1, 0.1, 0.1)
> a = hist(x,breaks=seq(-3,3,by=0.5))
> lines( c(min(a$breaks), a$mids, max(a$breaks)), c(0,a$counts,0), type='l' )


【推荐】国内首个AI IDE,深度理解中文开发场景,立即下载体验Trae
【推荐】凌霞软件回馈社区,携手博客园推出1Panel与Halo联合会员
【推荐】轻量又高性能的 SSH 工具 IShell:AI 加持,快人一步