openlayers4 入门开发系列结合 echarts4 实现散点图(附源码下载)
前言
openlayers4 官网的 api 文档介绍地址 openlayers4 api,里面详细的介绍 openlayers4 各个类的介绍,还有就是在线例子:openlayers4 官网在线例子,这个也是学习 openlayers4 的好素材。
openlayers4 入门开发系列的地图服务基于 Geoserver 发布的,关于 Geoserver 方面操作的博客,可以参考以下几篇文章:
内容概览
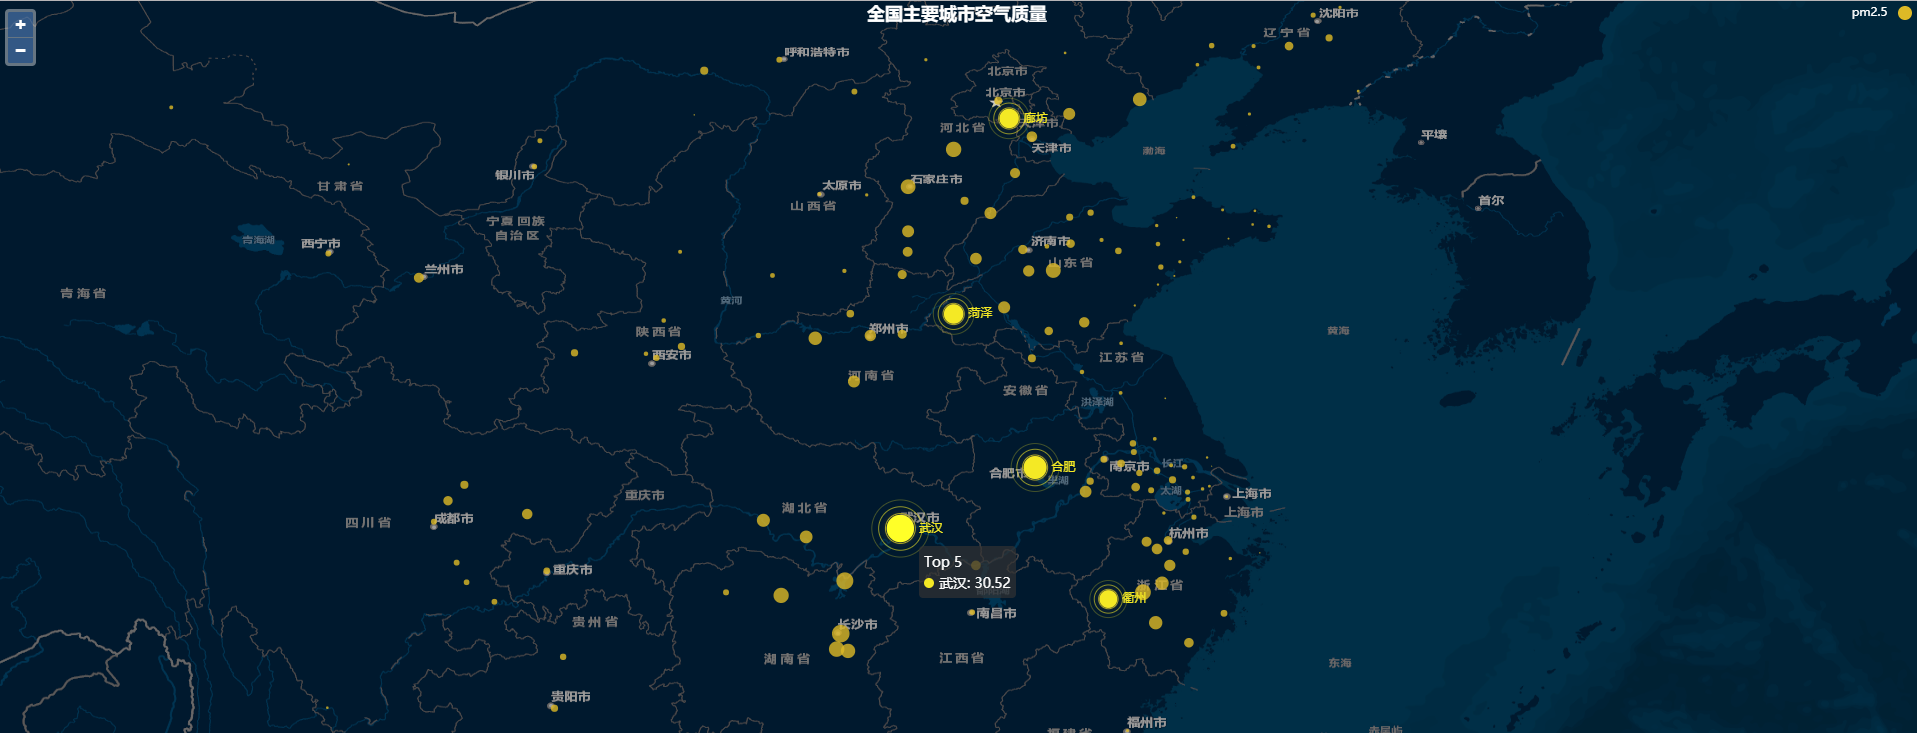
1.基于 openlayers4 结合 echarts4 实现散点图
2.源代码 demo 下载
效果图如下:

- 地图加载代码如下:
/**
* 地图创建初始化
*/
var map = new ol.Map({
target: 'map',
layers: [
new ol.layer.Tile({
source: new ol.source.XYZ({
url: 'http://cache1.arcgisonline.cn/arcgis/rest/services/ChinaOnline' +
'StreetPurplishBlue/MapServer/tile/{z}/{y}/{x}'
})
})
],
view: new ol.View({
center: [113.53450137499999, 34.44104525],
projection: 'EPSG:4326',
zoom: 6
})
});
- echarts数据源设置:
var res = {
"locations": [
{
"name": "海门",
"value": 9
}, {
"name": "鄂尔多斯",
"value": 12
}, {
"name": "招远",
"value": 12
}
……
],
"coordinates": {
"海门": [121.15, 31.89],
"鄂尔多斯": [109.781327, 39.608266],
……
}
}
var data = res.locations;
var geoCoordMap = res.coordinates;
var convertData = function (data) {
var res = [];
for (var i = 0; i < data.length; i++) {
var geoCoord = geoCoordMap[data[i].name];
if (geoCoord) {
res.push({
name: data[i].name,
value: geoCoord.concat(data[i].value)
});
}
}
return res;
};
var option = {
title: {
text: '全国主要城市空气质量',
subtext: '',
sublink: '',
left: 'center',
textStyle: {
color: '#fff'
}
},
tooltip: {
trigger: 'item'
},
openlayers: {},
legend: {
orient: 'vertical',
y: 'top',
x: 'right',
data: ['pm2.5'],
textStyle: {
color: '#fff'
}
},
series: [
{
name: 'pm2.5',
type: 'scatter',
data: convertData(data),
symbolSize: function (val) {
return val[2] / 10;
},
label: {
normal: {
formatter: '{b}',
position: 'right',
show: false
},
emphasis: {
show: true
}
},
itemStyle: {
normal: {
color: '#ddb926'
}
}
},
{
name: 'Top 5',
type: 'effectScatter',
data: convertData(data.sort(function (a, b) {
return b.value - a.value;
}).slice(0, 6)),
symbolSize: function (val) {
return val[2] / 10;
},
showEffectOn: 'render',
rippleEffect: {
brushType: 'stroke'
},
hoverAnimation: true,
label: {
normal: {
formatter: '{b}',
position: 'right',
show: true
}
},
itemStyle: {
normal: {
color: '#f4e925',
shadowBlur: 10,
shadowColor: '#333'
}
},
zlevel: 1
}]
};
- hideOnMoving=false 设置地图移动过程中不隐藏 echarts 效果,hideOnZooming=false 设置地图缩放过程中不隐藏 echarts 效果,stopEvent =false 设置不阻止echarts 事件
更多详情见下面链接文章:
GIS之家小专栏此文章:openlayers4 入门开发系列结合 echarts4 实现散点图(附源码下载)
文章提供源码,对本专栏感兴趣的话,可以关注一波
GIS之家作品店铺:GIS之家作品店铺
GIS之家源码咨询:GIS之家webgis入门开发系列demo源代码咨询
扫码关注GIS之家微信公众号,回复“gis”可免费获取地图数据以及arcgis系列安装包等资源
GIS之家源码咨询:GIS之家webgis入门开发系列demo源代码咨询
扫码关注GIS之家微信公众号,回复“gis”可免费获取地图数据以及arcgis系列安装包等资源


