

目标检测数据集分析
目标检测数据集分析
📢 新增支持数据集可视化,使用方法见Object-detection dataset analyze
项目地址
GitHub - Ghlerrix/DataAnalyze: Object-detection dataset analyze
图片数量、标注框数量、类别信息
这些信息会在终端打印出来,格式如下:
Parsing dataset, please wait...
Parsing done. (0.013s)

number of images: 1266
number of annotations: 2950
number of categories: 6
names of categories:  ['inclusion', 'rolled-in_scale', 'pitted_surface', 'patches', 'crazing', 'scratches']
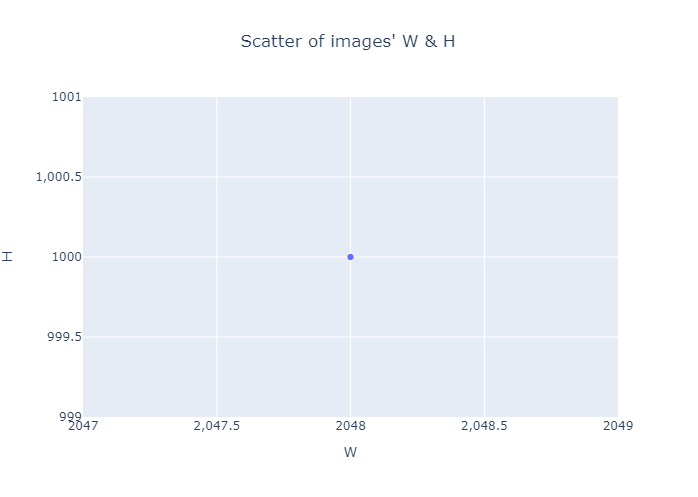
所有图片宽度和高度的散点图
这里只有一个点,是因为所有的图片尺寸相同
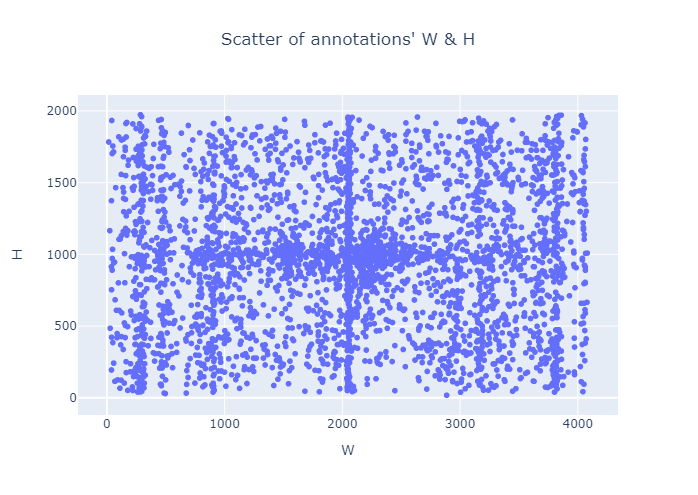
所有标注框宽度和高度的散点图
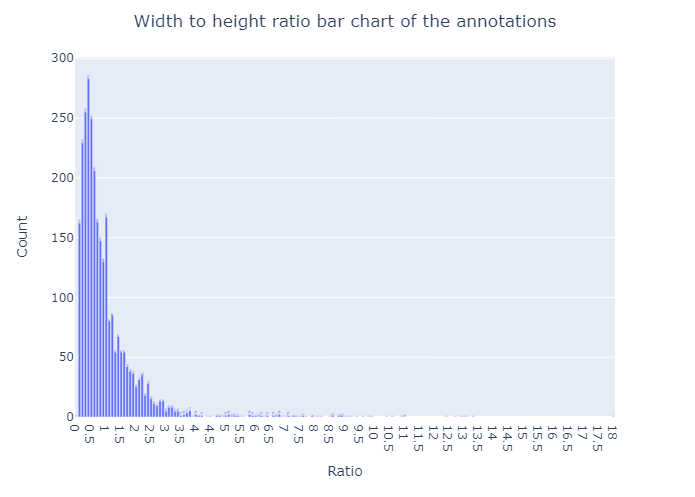
标注框宽度和高度之比 横坐标为比率,纵坐标为数量
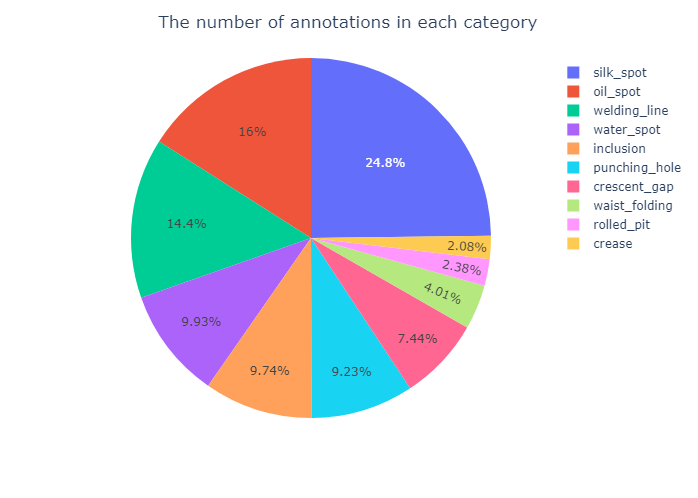
每一类的标注框数量

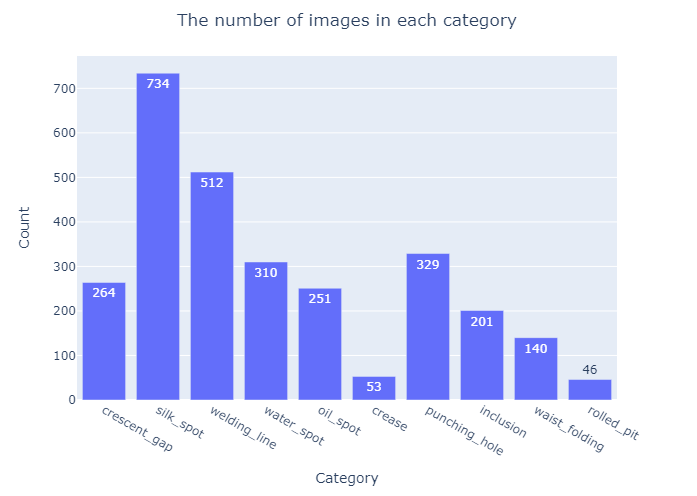
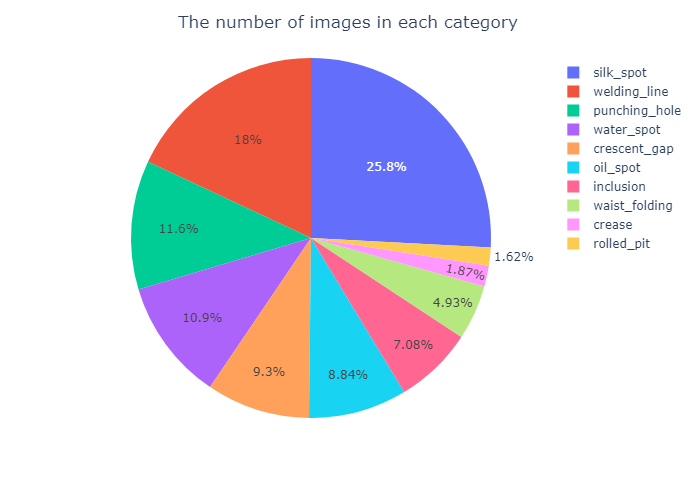
每一类图片数量
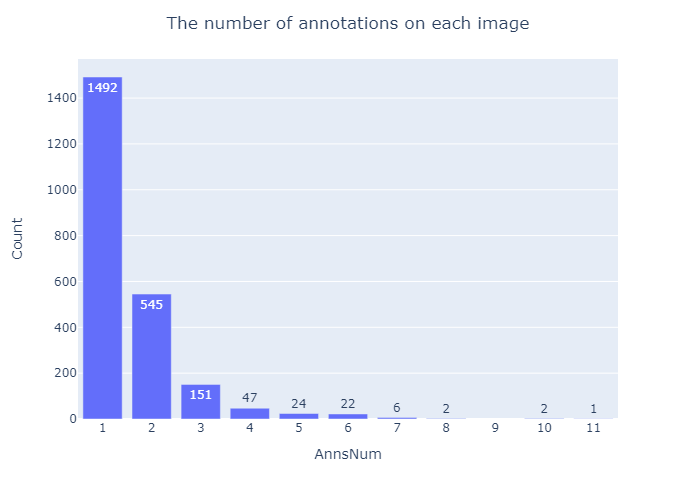
每一张图片上的标注框数量
横坐标为一张图片上的标注框数量,纵坐标为图片数量
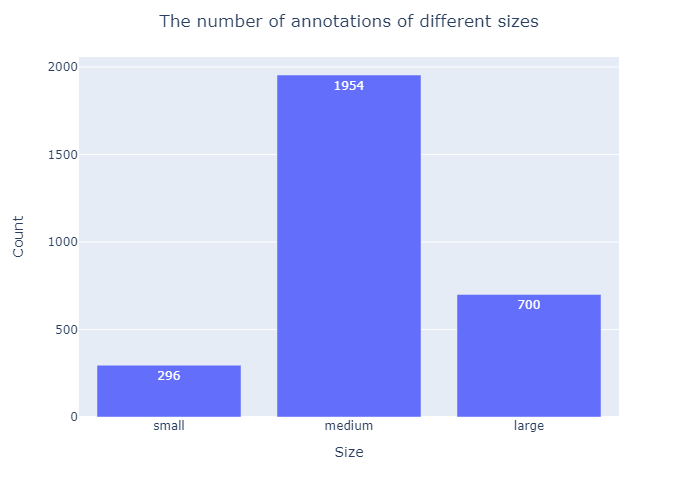
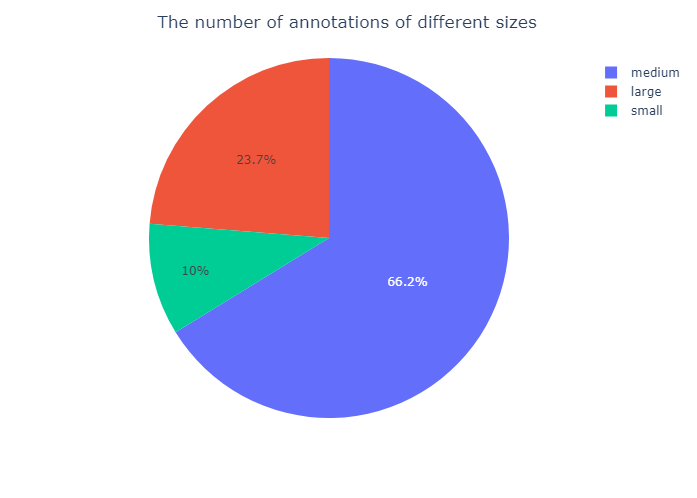
不同尺寸的图片数量
根据coco的划分规则计算
使用方法
GitHub - Ghlerrix/DataAnalyze: Object-detection dataset analyze
Install
git clone https://github.com/Ghlerrix/DataAnalyze.gitcd DataAnalyzepip install -r requirements.txt
Usage
python analyze.py ${type} ${path} [--out ${out}]
typeThe format of the dataset, optional ‘coco’ or ‘voc’.pathThe path of dataset. Iftypeis ‘coco’, thepathis the json file path. Iftypeis ‘voc’, thepathis the path of the xml file directory.-outis the output directory, default is ‘./out’
Example
python analyze.py coco ./tarin.json --out ./out/
python analyze.py voc ./xml/ --out ./out/

 浙公网安备 33010602011771号