
Prometheus监控告警搭建(纯二进制)

一、部署Prometheus
1、下载解压Prometheus
[root@192.168.0.2 disk]$ wget https://github.com/prometheus/prometheus/releases/download/v2.4.1/prometheus-2.4.1.linux-amd64.tar.gz
[root@192.168.0.2 disk]$ tar xf prometheus-2.4.1.linux-amd64.tar.gz
[root@192.168.0.2 disk]$ mv prometheus-2.4.1.linux-amd64 prometheus
# 创建配置目录和文件
[root@192.168.0.2 disk]$ mkdir /etc/prometheus && touch /etc/prometheus.yaml/prometheus.yaml
# 创建监控数据目录
[root@localhost ~]# mkdir /disk/prometheus/data
# 创建Prometheus系统服务文件
cat > /usr/lib/systemd/system/prometheus.service <<EOF
[Unit]
Description=The Prometheus monitoring system and time series database.
Documentation=https://prometheus.io
After=network.target

[Service]
User=root
LimitNOFILE=8192
ExecStart=/disk/prometheus/prometheus \\
    --config.file=/etc/prometheus/prometheus.yml \\
    --storage.tsdb.path=/disk/prometheus/data \\
    --web.console.templates=/disk/prometheus/consoles \\
    --web.console.libraries=/disk/prometheus/console_libraries \\
    --web.config.file=/etc/prometheus/web.yml \\
    --storage.tsdb.retention.time=30d
ExecReload=/bin/kill -HUP
Restart=on-failure

[Install]
WantedBy=multi-user.target
EOF
--web.config.file 参数设置的Prometheus界面认证信息
密码需要bcrypt算法加密的密文
# 安装httpd-tools
[root@localhost ~]# yum install httpd-tools –y

# 生成123456加密后的密文
[root@localhost ~]# htpasswd -nBC 12 '' | tr -d ':\n'
New password:
Re-type new password:
$2y$12$y4PaNc0UM0Jzi07jJf6zcuRFyp2GlH6F5rUKcE.xk3Aug2khcqa7m

# 创建认证文件
cat > /etc/prometheus/web.yml <<EOF
basic_auth_users:
  admin: $2y$12$y4PaNc0UM0Jzi07jJf6zcuRFyp2GlH6F5rUKcE.xk3Aug2khcqa7m
EOF
2、编辑Prometheus配置文件
global:
  scrape_interval: 15s

scrape_configs:
  - job_name: 'prometheus'
    scrape_interval: 5s
    basic_auth:
      username: admin
      password: 123456
    static_configs:
      - targets: ['localhost:9090']
3、启动Prometheus
systemctl daemon-reload
systemctl enable prometheus
systemctl start prometheus
systemctl status prometheus
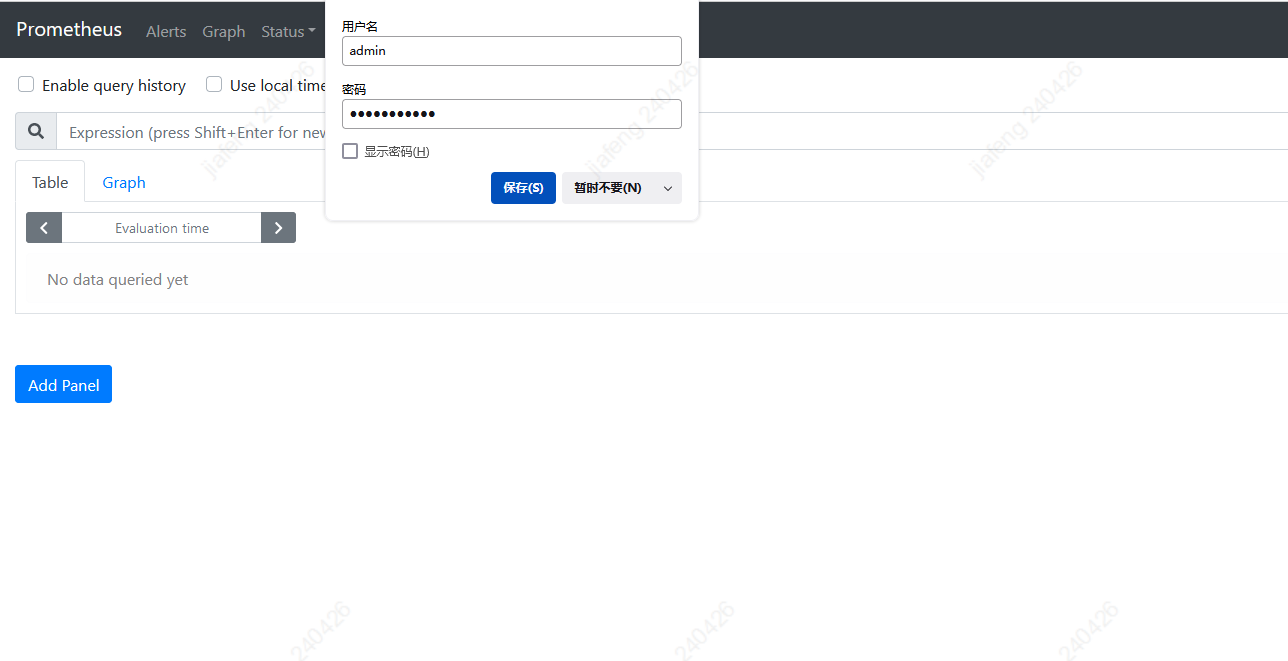
4、访问Prometheu
二、部署node_exporter
1、下载物料包
wget https://github.com/prometheus/node_exporter/releases/download/v1.3.0/node_exporter-1.3.0.linux-amd64.tar.gz
2、解压安装
tar xf node_exporter-1.3.0.linux-amd64.tar.gz
mv node_exporter-1.3.0.linux-amd64 /usr/local/node_exporter
mv /usr/local/node_exporter/node_exporter /usr/bin/node_exporter
# 创建认证文件
cat > /usr/local/node_exporter/config.yml<<EOF
basic_auth_users:
  prometheus: $2y$12$y4PaNc0UM0Jzi07jJf6zcuRFyp2GlH6F5rUKcE.xk3Aug2khcqa7m
EOF

# 创建系统服务
cat /usr/lib/systemd/system/node_exporter.service
[Unit]
Description=node_exporter
After=network.target

[Service]
ExecStart=/usr/bin/node_exporter --web.config=/usr/local/node_exporter/config.yml
Restart=on-failure

[Install]
WantedBy=multi-user.target
3、启动node_exporter
systemctl daemon-reload
systemctl enable node_exporter
systemctl start node_exporter
4、修改Prometheus配置,添加node_exporter配置
global:
  scrape_interval: 15s

scrape_configs:
  - job_name: 'prometheus'
    scrape_interval: 5s
    basic_auth:
      username: admin
      password: 123456
    static_configs:
      - targets: ['localhost:9090']

  - job_name: 'node'
    basic_auth:
      username: admin
      password: 123456
    static_configs:
      - targets: ['192.168.1.2:9100']
5、重启Prometheus
systemctl restart prometheus
三、配置告警规则
1、创建告警规则文件
[root@localhost ~]# cat /etc/prometheus/rules.yml
  groups:
    - name: node-status
      rules:
        - alert: NodeMemoryUsage
          annotations:
            summary: "{{$labels.hostname}}: High Memory usage detected"
            description: "{{$labels.hostname}}: Memory usage is above 70%"
          expr: |
            (node_memory_MemTotal_bytes - (node_memory_MemFree_bytes + node_memory_Buffers_bytes + node_memory_Cached_bytes)) / node_memory_MemTotal_bytes * 100 > 70
          for: 3m
          labels:
            severity: critical
        - alert: HighCpuLoad
          expr: 100-(avg(irate(node_cpu_seconds_total{mode="idle"}[5m])) by(instance)* 100) > 70
          for: 1m
          labels:
            severity: warning
          annotations:
            summary: "Host high CPU load (instance {{ $labels.hostname }})"
            description: "CPU load is > 80% LABELS = {{ $labels }}"
        - alert: IOperformance
          expr: 100-(avg(irate(node_disk_io_time_seconds_total[1m])) by(instance)* 100) < 60
          for: 1m
          labels:
            severity: critical
          annotations:
            summary:  "{{$labels.hostname}}: Inflow disk IO usage is too high!"
            description: "{{$labels.hostname}}: Inflow disk IO greater than 60%"
        - alert: DiskUsage
          expr: 100-(node_filesystem_free_bytes{fstype=~"ext4|xfs"}/node_filesystem_size_bytes {fstype=~"ext4|xfs"}*100) > 70
          for: 2m
          labels:
            severity: critical
          annotations:
            summary:  "{{$labels.hostname}}: Disk partition utilization is too high!"
            description: "{{$labels.hostname}}: Disk partition utilization is above 80%"
2、Prometheus引入规则文件
global:
  scrape_interval: 15s

rule_files:
  - '/etc/prometheus/rules.yml'

scrape_configs:
  - job_name: 'prometheus'
    scrape_interval: 5s
    basic_auth:
      username: admin
      password: 123456
    static_configs:
      - targets: ['192.168.1.2:9090']

  - job_name: 'node'
    basic_auth:
      username: admin
      password: 123456
    static_configs:
      - targets: ['192.168.1.2:9100']
3、重启Prometheus
systemctl restart prometheus
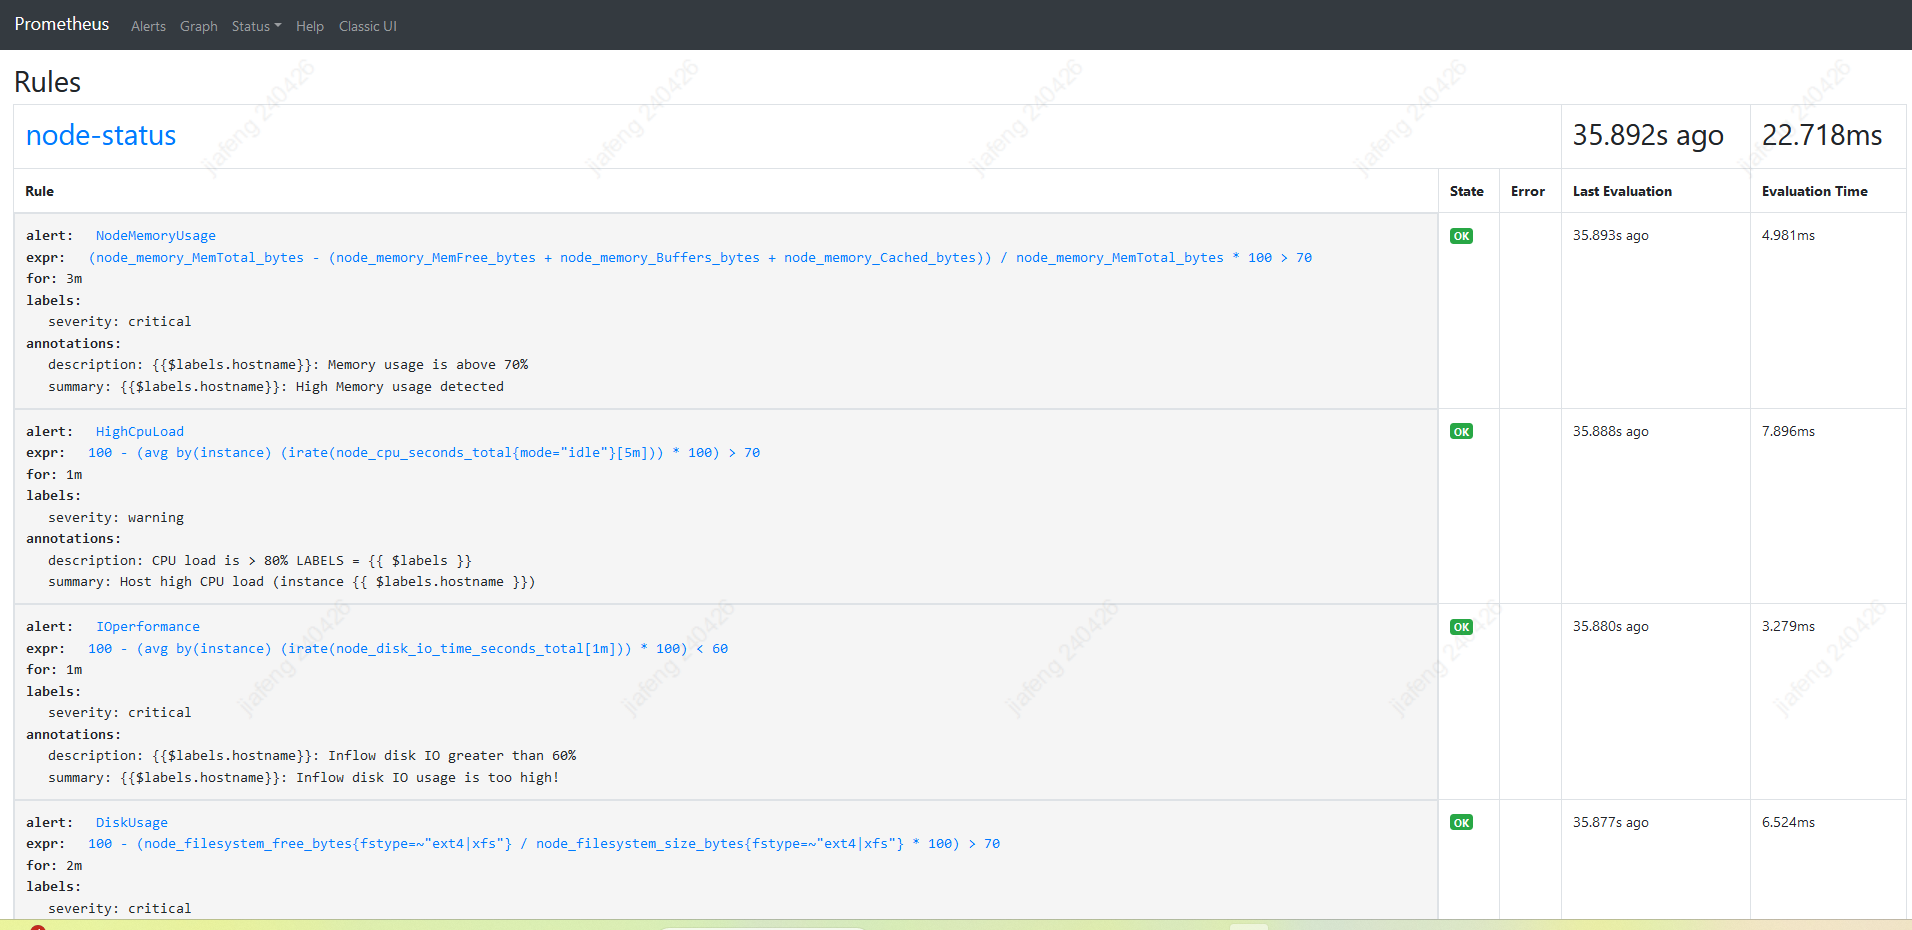
4、页面查看规则

四、部署alertmanager告警模块
1、下载物料包
wget https://github.com/prometheus/alertmanager/releases/download/v0.24.0/alertmanager-0.24.0.linux-amd64.tar.gz
2、解压安装
tar xf alertmanager-0.24.0.linux-amd64.tar.gz
mv alertmanager-0.24.0.linux-amd64 /disk/alertmanager

# alertmanager配置文件先保持默认

# 创建认证文件
cat > /disk/alertmanager/auth.yml <<EOF
basic_auth_users:
  prometheus: $2y$12$y4PaNc0UM0Jzi07jJf6zcuRFyp2GlH6F5rUKcE.xk3Aug2khcqa7m
EOF

# 创建告警数据文件
mkdir /disk/alertmanager/storage

# 创建系统服务
cat > /usr/lib/systemd/system/alertmanager.service <<EOF
[Unit]
Description=Alertmanager handles alerts sent by client applications such as the Prometheus server.
Documentation=https://prometheus.io/docs/alerting/alertmanager/
After=network.target

[Service]
User=root
ExecStart=/usr/bin/alertmanager \\
  --config.file=/disk/alertmanager/alertmanager.yml \\
  --storage.path=/disk/alertmanager/storage \\
  --web.config.file=/disk/alertmanager/auth.yml \\
  --web.listen-address=192.168.1.2:9093
ExecReload=/bin/kill -HUP
Restart=on-failure

[Install]
WantedBy=multi-user.target
EOF
3、启动alertmanager
systemctl daemon-reload
systemctl enale alertmanager
systemctl restart alertmanager
4、访问页面验证

五、部署配置钉钉告警
1、下载钉钉告警webhook模块
wget https://github.com/timonwong/prometheus-webhook-dingtalk/releases/download/v2.1.0/prometheus-webhook-dingtalk-2.1.0.linux-amd64.tar.gz
2、添加钉钉机器人

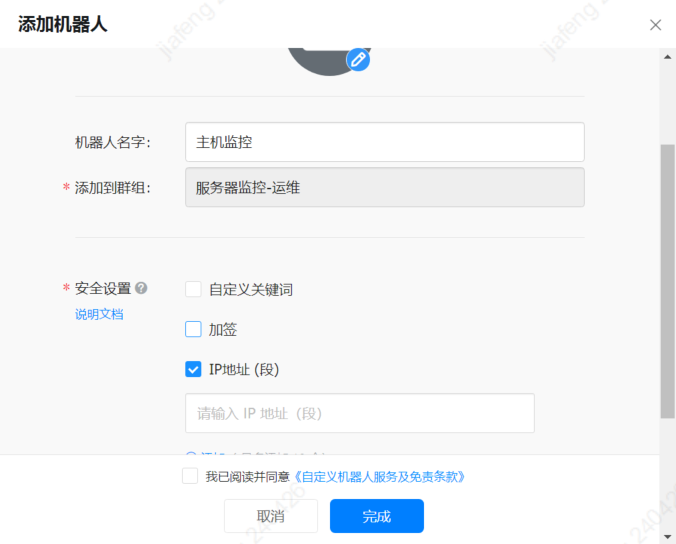
添加完自定义机器人过后会有一个机器人发送信息的webhook地址,例如:https://oapi.dingtalk.com/robot/send?access_token=xxx
2、解压安装dingtalk
tar xf prometheus-webhook-dingtalk-2.1.0.linux-amd64.tar.gz
mv prometheus-webhook-dingtalk-2.1.0.linux-amd64 /disk/dingtalk

# 备份修改配置文件
cp /disk/dingtalk/config.example.yml /disk/dingtalk/dingtalk.yml

cat > /disk/dingtalk/dingtalk.yml <<EOF
## Request timeout
timeout: 5s

targets:
  webhook1:
    url: https://oapi.dingtalk.com/robot/send?access_token=xxx
    mention:
      mobiles: ['131********', '182********']  ## 这里写谁的手机号,发送告警消息的时候会顺便@谁
EOF

# 创建系统服务
cat > /usr/lib/systemd/system/dingtalk.service <<EOF
[Unit]
Description=https://github.com/timonwong/prometheus-webhook-dingtalk

[Service]
Restart=on-failure
ExecStart=/disk/dingtalk/prometheus-webhook-dingtalk --config.file=/disk/dingtalk/dingtalk.yml --web.listen-address=:8060

[Install]
WantedBy=multi-user.target
EOF
3、启动dingtalk
systemctl daemon-reload
systemctl enable dingtalk
systemctl restart dingtalk
六、配置alertmanager和Prometheus实现钉钉告警
前面我们部署好了alertmanager和dingtalk但是二者并没有关联起来,现在我们配置一下使之相关联。
cat > /disk/alertmanager/alertmanager.yml <<EOF
global:
  resolve_timeout: 5m

route:
  group_by: ["alertname"]
  group_wait: 1m
  group_interval: 3m
  repeat_interval: 24h
  receiver: "webhook"

receivers:
  - name: 'webhook'
    webhook_configs:
      - url: 'http://192.168.1.2:8060/dingtalk/webhook1/send'
        send_resolved: true
EOF
重启alertmanager
systemctl restart alertmanager
最后我们在Prometheus配置文件中加上alertmanager的配置
global:
  scrape_interval: 15s

# Alertmanager configuration
alerting:
  alertmanagers:
    - static_configs:
        - targets: ['192.168.1.2:9093']
      basic_auth:
        username: admin
        password: 123456

rule_files:
  - '/etc/prometheus/rules.yml'

scrape_configs:
  - job_name: 'prometheus'
    scrape_interval: 5s
    basic_auth:
      username: admin
      password: 123456
    static_configs:
      - targets: ['192.168.1.2:9090']

  - job_name: 'node'
    basic_auth:
      username: admin
      password: 123456
    static_configs:
      - targets: ['192.168.1.2:9100']
重启Prometheus
systemctl restart prometheus
ok 大功告成!

 浙公网安备 33010602011771号