

The open source JavaScript graphing library that powers Plotly
https://plot.ly/javascript/time-series/
https://plot.ly/javascript/
https://github.com/plotly/plotly.js
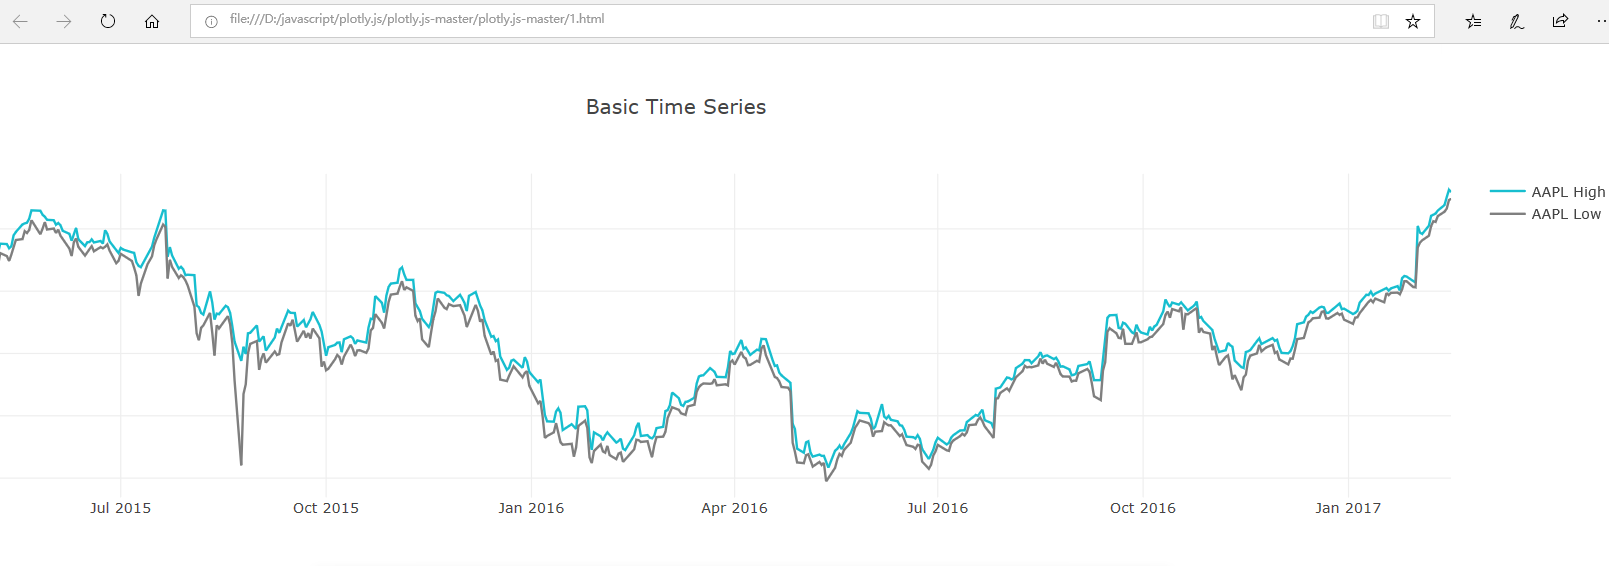
1 2 3 4 5 6 7 8 9 10 11 12 13 14 15 16 17 18 19 20 21 22 23 24 25 26 27 28 29 30 31 32 33 34 35 36 37 38 39 40 41 42 43 44 45 46 47 48 49 | <!DOCTYPE html><html><head><meta content="text/html; charset=utf-8" http-equiv="Content-Type" /><title>Time Series in plotly.js</title> <!-- Plotly.js --> <script src="dist/plotly.min.js" type="text/javascript"></script></head><body> <div id="myDiv"><!-- Plotly chart will be drawn inside this DIV --></div> <script> <!-- JAVASCRIPT CODE GOES HERE -->Plotly.d3.csv("finance-charts-apple.csv", function(err, rows){ function unpack(rows, key) { return rows.map(function(row) { return row[key]; });} var trace1 = { type: "scatter", mode: "lines", name: 'AAPL High', x: unpack(rows, 'Date'), y: unpack(rows, 'AAPL.High'), line: {color: '#17BECF'}}var trace2 = { type: "scatter", mode: "lines", name: 'AAPL Low', x: unpack(rows, 'Date'), y: unpack(rows, 'AAPL.Low'), line: {color: '#7F7F7F'}}var data = [trace1,trace2]; var layout = { title: 'Basic Time Series', };Plotly.newPlot('myDiv', data, layout);}) </script></body> |
1 2 3 4 5 6 7 8 9 10 11 12 13 14 15 16 17 18 19 20 21 22 23 24 25 26 27 28 29 30 31 32 33 34 35 36 37 38 39 40 41 42 43 44 45 46 47 48 49 50 51 52 53 54 | <!DOCTYPE html><html><head><meta content="text/html; charset=utf-8" http-equiv="Content-Type" /><title>Time Series in plotly.js</title> <!-- Plotly.js --> <script src="dist/plotly.min.js" type="text/javascript" charset="utf-8"></script> <script src="dist/plotly-locale-zh-cn.js" charset="utf-8" type="text/javascript"></script></head><body> <div id="myDiv"><!-- Plotly chart will be drawn inside this DIV --></div> <script> <!-- JAVASCRIPT CODE GOES HERE -->Plotly.setPlotConfig({locale: 'zh-CN'}) //月份显示中文Plotly.d3.csv("finance-charts-apple.csv", function(err, rows){ function unpack(rows, key) { return rows.map(function(row) { return row[key]; });} var trace1 = { type: "scatter", mode: "lines", name: 'AAPL High', x: unpack(rows, 'Date'), y: unpack(rows, 'AAPL.High'), line: {color: '#17BECF'}}var trace2 = { type: "scatter", mode: "lines", name: 'AAPL Low', x: unpack(rows, 'Date'), y: unpack(rows, 'AAPL.Low'), line: {color: '#7F7F7F'}}var data = [trace1,trace2]; var layout = { title: 'Basic Time Series', };Plotly.newPlot('myDiv', data, layout,{locale: 'zh-CN'}); //}) </script></body></html> |
哲学管理(学)人生, 文学艺术生活, 自动(计算机学)物理(学)工作, 生物(学)化学逆境, 历史(学)测绘(学)时间, 经济(学)数学金钱(理财), 心理(学)医学情绪, 诗词美容情感, 美学建筑(学)家园, 解构建构(分析)整合学习, 智商情商(IQ、EQ)运筹(学)生存.---Geovin Du(涂聚文)
分类:
Ajax&JavaScript
标签:
JavaScript
, Chart


【推荐】国内首个AI IDE,深度理解中文开发场景,立即下载体验Trae
【推荐】编程新体验,更懂你的AI,立即体验豆包MarsCode编程助手
【推荐】抖音旗下AI助手豆包,你的智能百科全书,全免费不限次数
【推荐】轻量又高性能的 SSH 工具 IShell:AI 加持,快人一步
· AI与.NET技术实操系列:基于图像分类模型对图像进行分类
· go语言实现终端里的倒计时
· 如何编写易于单元测试的代码
· 10年+ .NET Coder 心语,封装的思维:从隐藏、稳定开始理解其本质意义
· .NET Core 中如何实现缓存的预热?
· 25岁的心里话
· 闲置电脑爆改个人服务器(超详细) #公网映射 #Vmware虚拟网络编辑器
· 基于 Docker 搭建 FRP 内网穿透开源项目(很简单哒)
· 零经验选手,Compose 一天开发一款小游戏!
· 一起来玩mcp_server_sqlite,让AI帮你做增删改查!!
2017-06-26 csharp: Configuring ASP.NET with Spring.NET and FluentNHibernate
2010-06-26 asp.net3.5 csharp Calendar 控件显示周次
2009-06-26 jQuery InputHintBox