

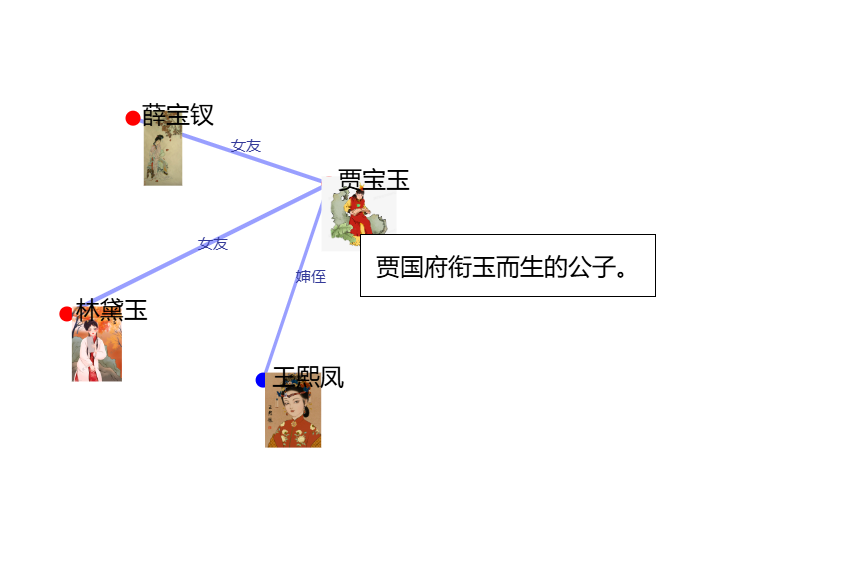
d3.js: Relation Graph
geovindu.json
1 2 3 4 5 6 7 8 9 10 11 12 13 14 15 16 17 18 19 20 21 22 23 24 25 26 27 28 29 30 31 32 33 34 35 36 37 38 39 40 | { "nodes": [ { "id": 0, "name": "贾宝玉", "image": "1.png", "group": 1, "description": "贾国府衔玉而生的公子。" }, { "id": 1, "name": "林黛玉", "image": "lin.jpg", "group": 1, "description": "贾亲密女友。" }, { "id": 3, "name": "薛宝钗", "image": "bao.jpg", "group": 1, "description": "贾府中意女子。" }, { "id": 4, "name": "王熙凤", "image": "wan.jpg", "group": 2, "description": "贾琏的妻子" } ], "links": [ { "source": 0, "target": 1, "value": 8, "relation": "女友" }, { "source": 0, "target": 3, "value": 7, "relation": "女友" }, { "source": 1, "target": 3, "value": 7, "relation": "情敌" }, { "source": 4, "target": 3, "value": 5, "relation": "外侄女" }, { "source": 4, "target": 1, "value": 5, "relation": "表妹" }, { "source": 4, "target": 0, "value": 5, "relation": "婶侄子" } ]} |
<!-- 引入 D3.js 库 -->
<script src="https://d3js.org/d3.v7.min.js"></script>
geovindu.js
1 2 3 4 5 6 7 8 9 10 11 12 13 14 15 16 17 18 19 20 21 22 23 24 25 26 27 28 29 30 31 32 33 34 35 36 37 38 39 40 41 42 43 44 45 46 47 48 49 50 51 52 53 54 55 56 57 58 59 60 61 62 63 64 65 66 67 68 69 70 71 72 73 74 75 76 77 78 79 80 81 82 83 84 85 86 87 88 89 90 91 92 93 94 95 96 97 98 99 100 101 102 103 104 105 106 107 108 109 110 111 112 113 114 115 116 117 118 119 120 121 122 123 124 125 126 127 128 129 130 131 132 133 134 135 136 137 138 139 140 141 142 143 144 145 146 147 148 149 150 151 152 153 154 155 156 157 158 159 160 161 | // JavaScript Document geovindu.jsconst svg = d3.select("#chart") .attr("width", 800) .attr("height", 500); const width = +svg.attr("width"); const height = +svg.attr("height"); const descriptionDiv = d3.select("#description"); d3.json("geovindu.json").then(data => { console.log("Loaded data:", data); console.log("Links:", data.links); // 创建连接线 const link = svg.append("g") .attr("class", "links") .selectAll("line") .data(data.links) .enter().append("line") .attr("stroke-width", d => Math.sqrt(d.value)); //先隐藏 link.style("opacity", 0); // 创建关系标签文字 const linkLabels = svg.append("g") .attr("class", "link-labels") .selectAll("text") .data(data.links) .enter().append("text") .text(d => d.relation) .attr("font-size", "10px") .attr("fill", "#333999"); // 创建节点 const node = svg.append("g") .attr("class", "nodes") .selectAll("g") .data(data.nodes) .enter().append("g"); const simulation = d3.forceSimulation() .force("link", d3.forceLink().id(d => d.id).distance(150)) // 调整链接距离 .force("charge", d3.forceManyBody().strength(-300)) // 调整电荷力强度 .force("center", d3.forceCenter(width / 2, height / 2)); const circles = node.append("circle") .attr("r", 5) .attr("fill", d => { if (d.group === 1) return "red"; else return "blue"; }); const images = node.append("image") .attr("href", d => d.image) .attr("x", -5) .attr("y", -5) .attr("width", 50) .attr("height", 50) .on("mouseover", (event, d) => { // 显示描述信息 descriptionDiv.style("display", "block") .style("left", (event.pageX + 10) + "px") .style("top", (event.pageY + 10) + "px") .html(d.description); // 显示与该节点相关的线条和关系名称标签 link.style("opacity", l => l.source === d || l.target === d ? 1 : 0); linkLabels.style("opacity", l => l.source === d || l.target === d ? 1 : 0); }) .on("mouseout", () => { // 隐藏描述信息 descriptionDiv.style("display", "none"); // 隐藏所有线条和关系名称标签 link.style("opacity", 0); linkLabels.style("opacity", 0); }) .on("error", (error, d) => { console.error(`Error loading image for ${d.name}:`, error); }); const labels = node.append("text") .text(d => d.name) .attr('x', 6) .attr('y', 3) .on("mouseover", (event, d) => { // 显示描述信息 descriptionDiv.style("display", "block") .style("left", (event.pageX + 10) + "px") .style("top", (event.pageY + 10) + "px") .html(d.description); // 显示与该节点相关的线条和关系名称标签 link.style("opacity", l => l.source === d || l.target === d ? 1 : 0); linkLabels.style("opacity", l => l.source === d || l.target === d ? 1 : 0); }) .on("mouseout", () => { // 隐藏描述信息 descriptionDiv.style("display", "none"); // 隐藏所有线条和关系名称标签 link.style("opacity", 0); linkLabels.style("opacity", 0); }); const drag = d3.drag() .on("start", dragstarted) .on("drag", dragged) .on("end", dragended); node.call(drag); simulation .nodes(data.nodes) .on("tick", ticked); simulation.force("link") .links(data.links); function ticked() { link .attr("x1", d => d.source.x) .attr("y1", d => d.source.y) .attr("x2", d => d.target.x) .attr("y2", d => d.target.y); // 更新关系标签文字的位置 linkLabels .attr("x", d => (d.source.x + d.target.x) / 2) .attr("y", d => (d.source.y + d.target.y) / 2); node .attr("transform", d => `translate(${d.x},${d.y})`); } function dragstarted(event, d) { if (!event.active) simulation.alphaTarget(0.3).restart(); d.fx = d.x; d.fy = d.y; } function dragged(event, d) { d.fx = event.x; d.fy = event.y; } function dragended(event, d) { if (!event.active) simulation.alphaTarget(0); d.fx = null; d.fy = null; } }).catch(error => { console.error("Error loading data:", error); }); |
geovindu.css
1 2 3 4 5 6 7 8 9 10 11 12 13 14 15 16 17 18 19 20 21 22 23 24 25 26 27 28 29 30 31 32 33 34 35 36 | @charset "utf-8";/* CSS Document geovindu.css geovindu,Geovin Du */ .node circle { fill: #cccccc; stroke: steelblue; stroke-width: 3px; } .node text { font: 12px sans-serif; cursor: pointer; } .links { fill: none; stroke: #999fff; stroke-width: 2px; opacity: 1; /* 初始时连接线隐藏 */ transition: opacity 0.3s; } .link-labels text { font-size: 10px; fill: #333999; opacity: 0; /* 初始时关系名称标签隐藏 */ transition: opacity 0.3s; } #description { position: absolute; background-color: white; border: 1px solid black; padding: 10px; display: none; } |
1 2 3 4 5 6 7 8 9 10 11 12 13 14 15 16 17 18 19 20 21 22 | <!DOCTYPE html><html lang="en"> <head> <meta charset="UTF-8"> <meta name="viewport" content="width=device-width, initial-scale=1.0"> <title>简单人物关系图谱 Relation Graph </title> <link rel="shortcut icon" href="/favicon.ico"><meta content="Relation Graph 涂聚文,Geovin Du,塗聚文,geovindu,捷为工作室" name="keywords"><meta content="Relation Graph 涂聚文,Geovin Du,塗聚文,geovindu,捷为工作室" name="description"> <script src="./d3/7.9.0/d3.js"></script> <link rel="stylesheet" type="text/css" href="./geovindu.css" /></head> <body> <svg id="chart" width="800" height="600"></svg> <div id="description"></div> <script type="text/javascript" src="geovindu.js"> </script></body> </html> |
哲学管理(学)人生, 文学艺术生活, 自动(计算机学)物理(学)工作, 生物(学)化学逆境, 历史(学)测绘(学)时间, 经济(学)数学金钱(理财), 心理(学)医学情绪, 诗词美容情感, 美学建筑(学)家园, 解构建构(分析)整合学习, 智商情商(IQ、EQ)运筹(学)生存.---Geovin Du(涂聚文)
分类:
Ajax&JavaScript


【推荐】国内首个AI IDE,深度理解中文开发场景,立即下载体验Trae
【推荐】编程新体验,更懂你的AI,立即体验豆包MarsCode编程助手
【推荐】抖音旗下AI助手豆包,你的智能百科全书,全免费不限次数
【推荐】轻量又高性能的 SSH 工具 IShell:AI 加持,快人一步
· 25岁的心里话
· 闲置电脑爆改个人服务器(超详细) #公网映射 #Vmware虚拟网络编辑器
· 基于 Docker 搭建 FRP 内网穿透开源项目(很简单哒)
· 零经验选手,Compose 一天开发一款小游戏!
· 一起来玩mcp_server_sqlite,让AI帮你做增删改查!!
2024-01-30 CSharp: iText-donet 8.0 in donet 4.8.1
2018-01-30 JqGrid: paging int asp.net
2013-01-30 Csharp: 打印設置字符之間的間距