

Javascript: Flotr2 Examples : data visualization with javascript
1 2 3 4 5 6 7 8 9 10 11 12 13 14 15 16 17 18 19 20 21 22 23 24 25 26 27 28 29 30 31 32 33 34 35 36 37 38 39 40 41 42 43 44 45 46 47 48 49 50 51 52 53 54 55 56 57 58 59 60 61 62 63 64 65 66 67 68 69 70 71 72 73 74 75 76 77 78 79 80 81 82 83 84 85 86 87 88 89 90 91 92 93 | <!doctype html><html><head><meta charset="utf-8"> <meta name="viewport" content="width=device-width,initial-scale=1.0,maximum-scale=1.0,minimum-scale=1.0,user-scalable=no"> <meta http-equiv="X-UA-Compatible" content="ie=edge"><title>Flotr2 Examples : data visualization with javascript</title> <meta name="Description" content="geovindu"/><meta name="Keywords" content="geovindu"/><meta name="author" content="geovindu"/> <script src="../ajax/libs/modernizr/2.8.3/modernizr.min.js" type="text/javascript"></script> <link rel='stylesheet' href='../bootstrap/4.6.2/css/bootstrap.min.css'> <link rel="stylesheet" href="../css/main.css"> <style type="text/css"> body { margin: 0px; padding: 0px; } #container { width : 600px; height: 384px; margin: 8px auto; } </style></head><body> <script src="../js/jquery-3.6.0.js"></script> <div id="container"></div> <!--[if IE]> <script type="text/javascript" src="flotr2.ie.min.js"></script> <![endif]--> <script type="text/javascript" src="flotr2.min.js"></script> <script type="text/javascript"> //https://github.com/HumbleSoftware/Flotr2 geovindu edit //https://humblesoftware.com/flotr2#!basic //https://www.flotcharts.org/flot/examples/(function() { var d1 = [ [ [0,1085], [1,5195], [2,17751], [3,72080], [4,24974], [5,23903], [6,17903], [7,11236], [8,29], [9,20] ]]; // First data series var d2 = [ [0,"2013"], [1,"2014"], [2,"2015"], [3,"2016"], [4,"2017"], [5,"2018"], [6,"2019"], [7,"2020"], [8,"2021"], [9,"2022"]]; console.log(d1); console.log(d2); // Draw the graph Flotr.draw(document.getElementById("container"),d1,{ title:"geovindu,涂聚文", coloer:["#89AFD2"], bars : { show : true, barWidth : 0.5 }, mouse : { track : true, relative : true }, yaxis : { min : 0, tickDecimals:0 }, xaxis: { ticks:d2 } });})();</script></body></html> |
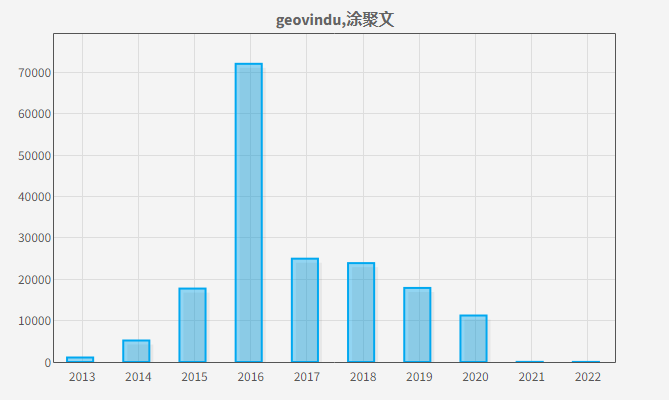
1 2 3 4 5 6 7 8 9 10 11 12 13 14 15 16 17 18 19 20 21 22 23 24 25 26 27 28 29 30 31 32 33 34 35 36 37 38 39 40 41 42 43 44 45 46 47 48 49 50 51 52 53 54 55 56 57 58 59 60 61 62 63 64 65 66 67 68 69 70 71 72 73 74 75 76 77 78 79 80 81 82 83 84 85 86 87 88 89 90 91 92 93 94 95 96 97 | <!doctype html><html><head><meta charset="utf-8"> <meta name="viewport" content="width=device-width,initial-scale=1.0,maximum-scale=1.0,minimum-scale=1.0,user-scalable=no"> <meta http-equiv="X-UA-Compatible" content="ie=edge"><title>Flotr2 Examples : data visualization with javascript</title> <meta name="Description" content="geovindu"/><meta name="Keywords" content="geovindu"/><meta name="author" content="geovindu"/> <script src="ajax/libs/modernizr/2.8.3/modernizr.min.js" type="text/javascript"></script> <link rel='stylesheet' href='bootstrap/4.6.2/css/bootstrap.min.css'> <link rel="stylesheet" href="css/main.css"> <style type="text/css"> body { margin: 0px; padding: 0px; } #container { width : 600px; height: 384px; margin: 8px auto; } </style></head><body> <script src="js/jquery-3.6.0.js"></script> <div id="container"></div> <!--[if IE]> <script type="text/javascript" src="ajax/libs/Flotr2/flotr2.ie.min.js"></script> <![endif]--> <script type="text/javascript" src="ajax/libs/Flotr2/flotr2.min.js"></script> <script type="text/javascript"> //https://github.com/HumbleSoftware/Flotr2 geovindu edit //https://humblesoftware.com/flotr2#!basic //https://www.flotcharts.org/flot/examples/(function() { var d1 = [ [ [0,1085], [1,5195], [2,17751], [3,72080], [4,24974], [5,23903], [6,17903], [7,11236], [8,29], [9,20] ]]; // First data series var d2 = [ [0,"2013"], [1,"2014"], [2,"2015"], [3,"2016"], [4,"2017"], [5,"2018"], [6,"2019"], [7,"2020"], [8,"2021"], [9,"2022"]]; console.log(d1); console.log(d2); // Draw the graph Flotr.draw(document.getElementById("container"),d1,{ title:"2013年--2020年生日数据 geovindu,涂聚文", colors:["#DF021D"], bars : { show : true, barWidth : 0.5 }, mouse : { track : true, relative : true }, yaxis : { min : 0, tickDecimals:0 }, xaxis: { ticks:d2 }, grid:{ horizontalLines:true, verticalLines:true } });})();</script></body></html> |
哲学管理(学)人生, 文学艺术生活, 自动(计算机学)物理(学)工作, 生物(学)化学逆境, 历史(学)测绘(学)时间, 经济(学)数学金钱(理财), 心理(学)医学情绪, 诗词美容情感, 美学建筑(学)家园, 解构建构(分析)整合学习, 智商情商(IQ、EQ)运筹(学)生存.---Geovin Du(涂聚文)


【推荐】国内首个AI IDE,深度理解中文开发场景,立即下载体验Trae
【推荐】编程新体验,更懂你的AI,立即体验豆包MarsCode编程助手
【推荐】抖音旗下AI助手豆包,你的智能百科全书,全免费不限次数
【推荐】轻量又高性能的 SSH 工具 IShell:AI 加持,快人一步
· 使用C#创建一个MCP客户端
· 分享一个免费、快速、无限量使用的满血 DeepSeek R1 模型,支持深度思考和联网搜索!
· ollama系列1:轻松3步本地部署deepseek,普通电脑可用
· 基于 Docker 搭建 FRP 内网穿透开源项目(很简单哒)
· 按钮权限的设计及实现
2009-12-12 香港拼音-汉字对照表
2009-12-12 第6期(江西省吉安市永丰县)县长手机信箱工作简报(自吹自擂政绩,自圆其说)