

highcharts.Js
1 2 3 4 5 6 7 8 9 10 11 12 13 14 15 16 17 18 19 20 21 22 23 24 25 26 27 28 29 30 31 32 33 34 35 36 37 38 39 40 41 42 43 44 45 46 47 48 49 50 51 52 53 54 55 56 57 58 59 60 61 62 63 64 65 66 67 68 69 70 71 72 73 74 75 76 77 78 79 80 81 82 83 84 85 86 87 88 89 90 91 92 93 94 95 96 97 98 99 100 101 102 103 104 105 106 107 108 109 110 111 112 113 114 115 116 | <!DOCTYPE><html><head runat="server"> <meta charset="UTF-8" /> <title>geovindu</title> <meta name="keywords" content="Geovin Du"/> <meta name="description" content="Geovin Du" /> <meta name="author" content="Geovin Du" /> <meta name="copyright" content="涂聚文 Geovin Du" /> <meta name="robots" content="follow, all" /> <script type="text/javascript" src="http://code.jquery.com/jquery-1.9.1.js"></script> <script src="http://code.highcharts.com/highcharts.js" type="text/javascript"></script> <script type="text/javascript" src="js/highcharts-zh_CN.js"></script> <!-- 2. Include the Highcharts exporting module script. --> <script src="http://code.highcharts.com/modules/exporting.js" type="text/javascript"></script> <script type="text/javascript"> var chart = null; var strtile='<%=strtitle %>' $(function () { chart = Highcharts.chart('container', { chart: { zoomType: 'x' }, title: { text: strtile+'新冠状病毒病 , 开始日期:1/22/2020 create dusystem.com' }, subtitle: { text: 'Source:by the Center for Systems Science and Engineering (CSSE) at Johns Hopkins University (JHU) 疫情数据 ' }, yAxis: { title: { text: 'Number of COVID-19' } }, xAxis: { type: 'datetime', minRange: 1 * 24 * 3600000, // 1天 dateTimeLabelFormats: { day: '%Y-%m-%d', week: '%m-%d', month: '%Y-%m', year: '%Y' }, labels: { format: '{value:%Y-%b-%e}' }, accessibility: { rangeDescription: 'Range: 2020 to 2020' } }, legend: { layout: 'vertical', align: 'right', verticalAlign: 'middle' }, plotOptions: { series: { label: { connectorAllowed: false }, pointInterval: 24 * 3600 * 1000, //1天 pointStart: Date.UTC(2020, 0, 22) //2020/1/22 } }, series: [ { name: 'Confirmed', //确诊人数 data: <%=jsonConfirmed %> }, { name: 'Deaths', //死亡人数 data: <%=jsonDeaths %> }, { name: 'Recovered', //治愈人数 data: <%=jsonRecovered %> } ], responsive: { rules: [{ condition: { maxWidth: 500 }, chartOptions: { legend: { layout: 'horizontal', align: 'center', verticalAlign: 'bottom' } } }] } }); });</script></head><body> <form id="form1" runat="server"> <div> <asp:GridView ID="GridView1" runat="server"> </asp:GridView> <div id="container" style="max-width:800px;height:400px"></div> </div> </form></body></html> |
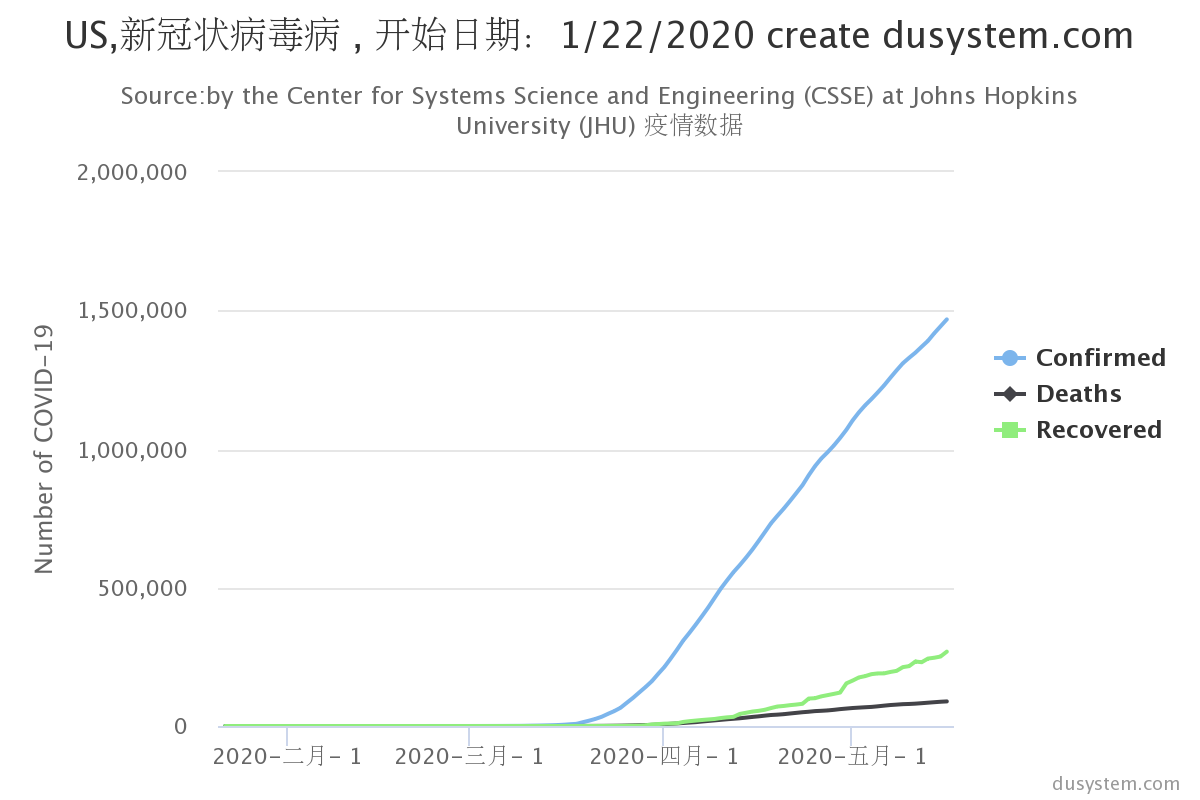
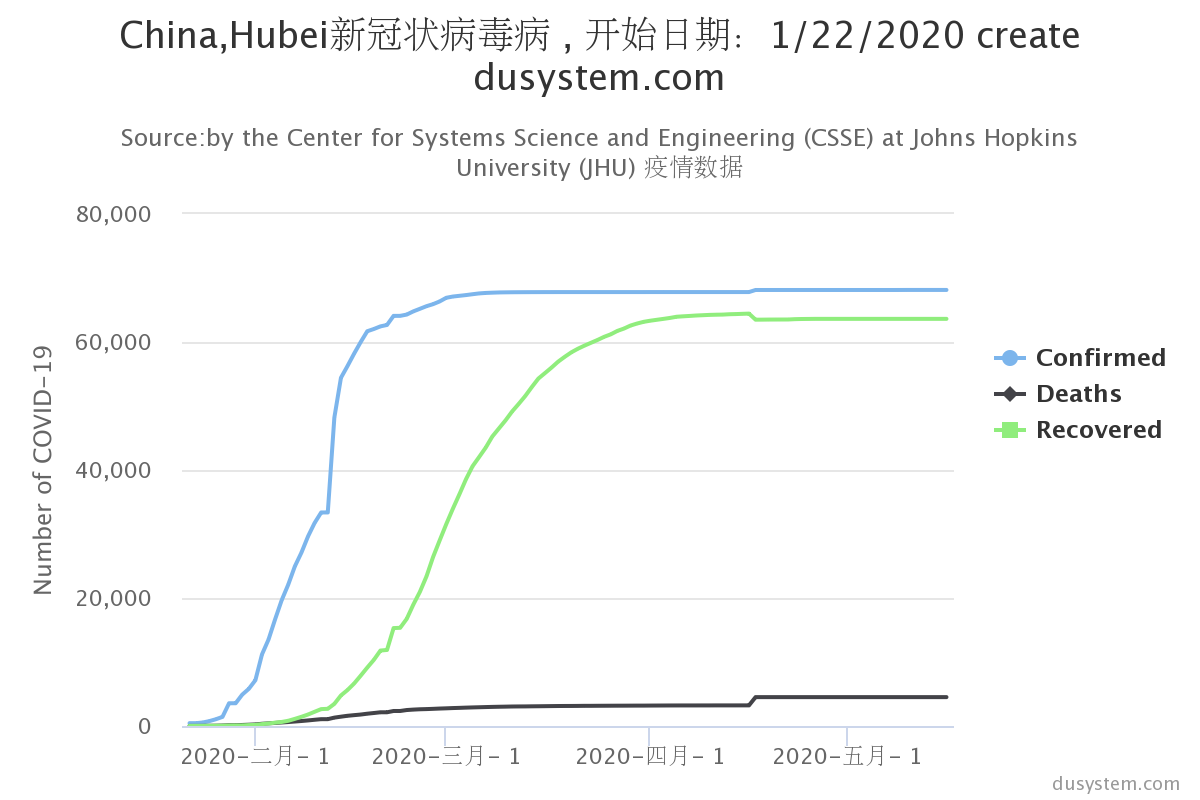
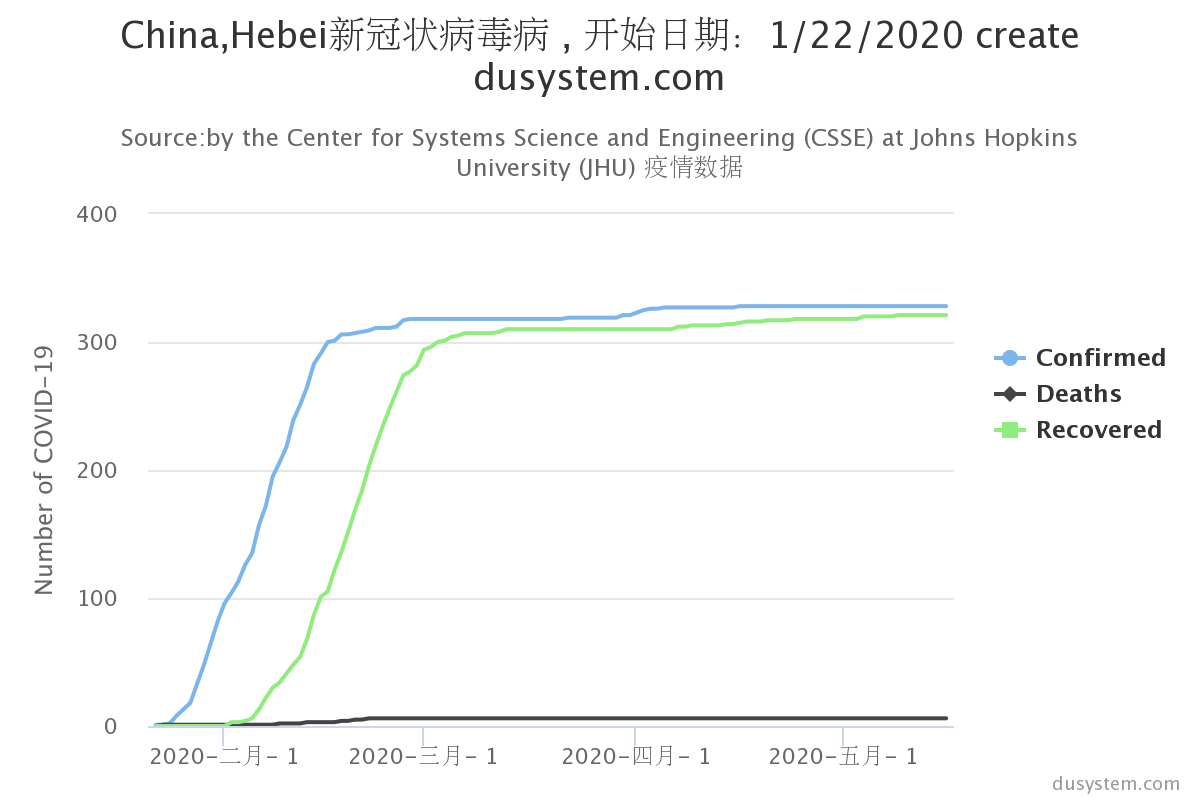
数据来源:https://corona-virus-covid19.com/
https://covid2019-api.herokuapp.com/docs
1 2 3 4 5 6 7 8 9 10 11 12 13 14 15 16 17 18 19 20 21 22 23 24 25 26 27 28 29 30 31 32 33 34 35 36 37 38 39 40 41 42 43 44 45 46 47 48 49 50 51 52 53 54 55 56 57 58 59 60 61 62 63 64 65 66 67 68 69 70 71 72 73 74 75 76 77 78 79 80 81 82 83 84 85 86 87 88 89 90 91 92 93 94 95 96 97 98 99 100 101 102 103 104 105 106 107 108 109 110 111 112 113 114 115 116 117 118 119 120 121 122 123 124 125 126 127 128 129 130 131 132 133 134 135 136 137 138 139 140 141 | <!DOCTYPE HTML><html><head runat="server"><meta http-equiv="Content-Type" content="text/html; charset=utf-8"> <meta name="viewport" content="width=device-width, initial-scale=1"> <title>Highcharts Example</title> <meta name="keywords" content="Geovin Du"/> <meta name="description" content="Geovin Du" /> <meta name="author" content="Geovin Du" /> <meta name="copyright" content="涂聚文 Geovin Du" /> <meta name="robots" content="follow, all" /><script type="text/javascript" src="Highcharts/code/highcharts.js"></script><script type="text/javascript" src="Highcharts/code/modules/series-label.js"></script><script type="text/javascript" src="Highcharts/code/modules/exporting.js"></script><script type="text/javascript" src="Highcharts/code/modules/export-data.js"></script><script type="text/javascript" src="Highcharts/code/modules/accessibility.js"></script><script type="text/javascript" src="Highcharts/code/highcharts-zh_CN.js"></script> <style type="text/css">.highcharts-figure, .highcharts-data-table table { min-width: 360px; max-width: 800px; margin: 1em auto;}.highcharts-data-table table { font-family: Verdana, sans-serif; border-collapse: collapse; border: 1px solid #EBEBEB; margin: 10px auto; text-align: center; width: 100%; max-width: 500px;}.highcharts-data-table caption { padding: 1em 0; font-size: 1.2em; color: #555;}.highcharts-data-table th { font-weight: 600; padding: 0.5em;}.highcharts-data-table td, .highcharts-data-table th, .highcharts-data-table caption { padding: 0.5em;}.highcharts-data-table thead tr, .highcharts-data-table tr:nth-child(even) { background: #f8f8f8;}.highcharts-data-table tr:hover { background: #f1f7ff;} </style></head><body> <form id="form1" runat="server"> <div> <figure class="highcharts-figure"> <div id="container"></div> <p class="highcharts-description"> Basic line chart showing trends in a dataset. This chart includes the <code>series-label</code> module, which adds a label to each line for enhanced readability. </p></figure> </div> </form> <script type="text/javascript"> Highcharts.chart('container', { title: { text: 'Solar Employment Growth by Sector, 2010-2016' }, subtitle: { text: '中国: dusystem.com 涂聚文' }, yAxis: { title: { text: 'Number of Employees' } }, xAxis: { accessibility: { rangeDescription: 'Range: 2010 to 2017' } }, legend: { layout: 'vertical', align: 'right', verticalAlign: 'middle' }, plotOptions: { series: { label: { connectorAllowed: false }, pointStart: 2010 } }, series: [{ name: 'Installation', data: [43934, 52503, 57177, 69658, 97031, 119931, 137133, 154175] }, { name: 'Manufacturing', data: [24916, 24064, 29742, 29851, 32490, 30282, 38121, 40434] }, { name: 'Sales & Distribution', data: [11744, 17722, 16005, 19771, 20185, 24377, 32147, 39387] }, { name: 'Project Development', data: [null, null, 7988, 12169, 15112, 22452, 34400, 34227] }, { name: 'Other', data: [12908, 5948, 8105, 11248, 8989, 11816, 18274, 18111] }], responsive: { rules: [{ condition: { maxWidth: 500 }, chartOptions: { legend: { layout: 'horizontal', align: 'center', verticalAlign: 'bottom' } } }] } }); </script></body></html> |
哲学管理(学)人生, 文学艺术生活, 自动(计算机学)物理(学)工作, 生物(学)化学逆境, 历史(学)测绘(学)时间, 经济(学)数学金钱(理财), 心理(学)医学情绪, 诗词美容情感, 美学建筑(学)家园, 解构建构(分析)整合学习, 智商情商(IQ、EQ)运筹(学)生存.---Geovin Du(涂聚文)
分类:
Ajax&JavaScript
标签:
highcharts
, Chart


【推荐】国内首个AI IDE,深度理解中文开发场景,立即下载体验Trae
【推荐】编程新体验,更懂你的AI,立即体验豆包MarsCode编程助手
【推荐】抖音旗下AI助手豆包,你的智能百科全书,全免费不限次数
【推荐】轻量又高性能的 SSH 工具 IShell:AI 加持,快人一步
· AI与.NET技术实操系列:基于图像分类模型对图像进行分类
· go语言实现终端里的倒计时
· 如何编写易于单元测试的代码
· 10年+ .NET Coder 心语,封装的思维:从隐藏、稳定开始理解其本质意义
· .NET Core 中如何实现缓存的预热?
· 25岁的心里话
· 闲置电脑爆改个人服务器(超详细) #公网映射 #Vmware虚拟网络编辑器
· 基于 Docker 搭建 FRP 内网穿透开源项目(很简单哒)
· 零经验选手,Compose 一天开发一款小游戏!
· 一起来玩mcp_server_sqlite,让AI帮你做增删改查!!
2017-05-17 sql server: quering roles, schemas, users,logins