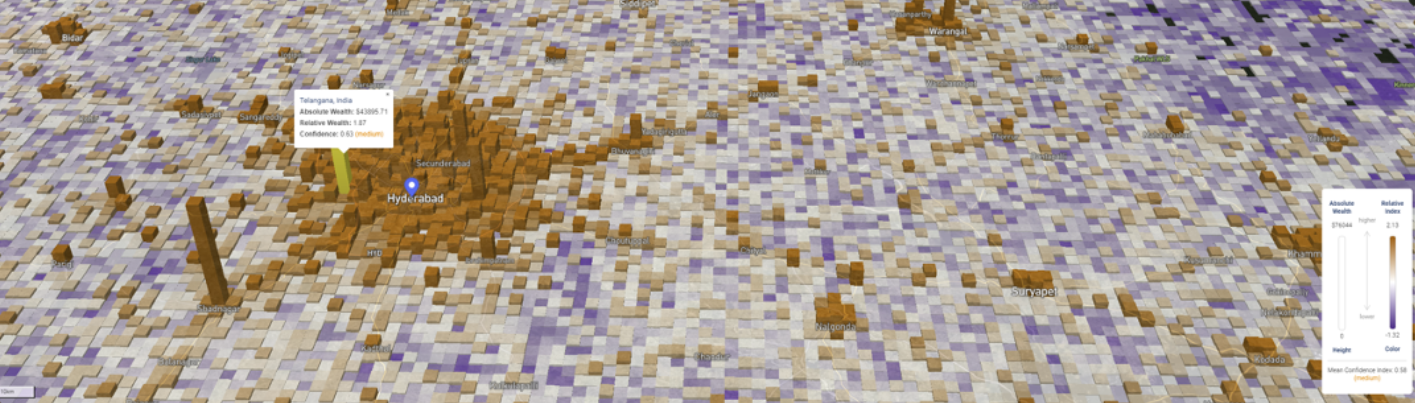
Micro-Estimates of Wealth for all Low 数据搜集
Micro-Estimates of Wealth for all Low- and Middle-Income Countries
1. The first test uses data from 15 LMICs that have collected and published census data since 2001 (SI Appendix, Table S3).
These data contain census survey responses from 27 million unique individuals, including questions about the economic circumstances of each household. Importantly, the census data are independently collected and are never used to train the ML model. In each country, we aggregate the census data at the smallest administrative unit possible and calculate a “census wealth index” as the average wealth of households in that census unit. We separately aggregate the 2.4-km wealth estimates from the ML model to the same administrative unit. The ML model explains 72% of the variation in household wealth across the 979 census units formed by pooling data from the 15 censuses (Fig. 3C) and, on average, 86% of the variation in household wea
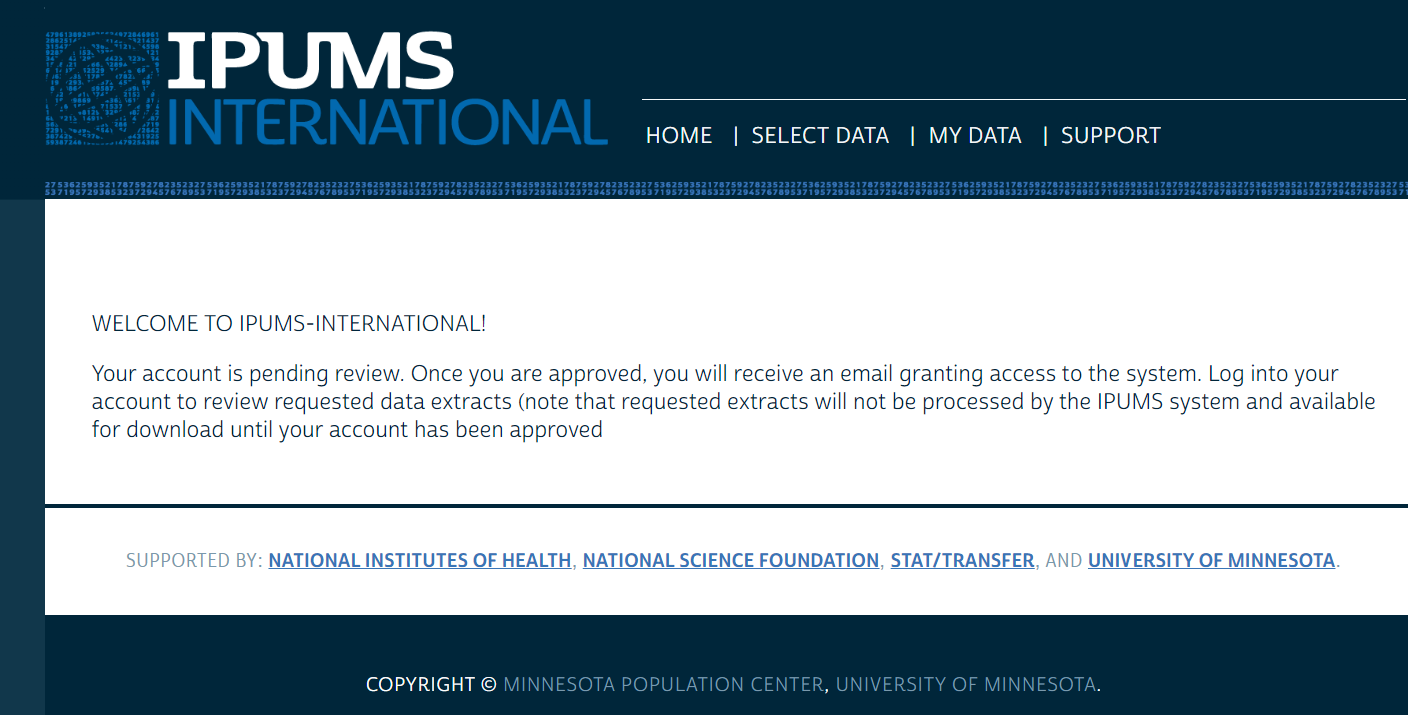
https://international.ipums.org/international/index.shtml
2. The first dataset, collected by the government of the Togolese Republic (Togo) from 2018 to 2019
contains a nationally representativ sample of 6,172 households located in 922 unique 2.4-km grid cells (Fig. 4A).
We find that the ML model’s predictions explain 76% of the variation in wealth of these grid cells (Fig. 4B) and 84% of the variation in wealth of cantons, Togo’s smallest administrative unit (Fig. 4C). EHCVM WORLDBANK
3. The second dataset, similar to the first one but independently collected by the government of Nigeria in 2019
contains a nationally representative sample of 22,104 households in 2,446 grid cells (Fig. 4D).
During the 2018 to 2019 Nigerian Living Standards Survey (NLSS), Nigeria’s National Bureau of Statistics, in collaboration with the World Bank, conducted a nationally representative household survey with 22,104 households (Fig. 4D). The survey excluded Borno State due to security concerns (see ttps://www.nigerianstat.gov.ng/nada/index.php/catalog/64). Like the EHCVM in Togo, the NLSS in Nigeria contains a wealth index for each household and each household’s exact geocoordinates. The 22,104 households are located in 2,446 unique 2.4-km grid cells. We compare the NLSS microdata, which were never used to train the model, to the final estimates of the ML model.
不发邮件,但是和2类似。
4. We further validate the grid-level predictions using a dataset collected by GiveDirectly
a nonprofit organization that provides humanitarian aid to poor households. In 2018, GiveDirectly surveyed 5,703 households in two counties in Kenya (Fig. 4G), recording a poverty probability index as well as the exact geocoordinates of each household (Fig. 4H).
PPI:index,没有公开产品,根据其他问卷例如DHS计算得到的INDEX
KENYA: GiveDirectly These data were collected by GiveDirectly, a nonprofit organization that provides unconditional cash transfers to poor households. When GiveDirectly works in a village, they typically conduct a socioeconomic survey with every household in the village. The survey includes a standardized set of 10 questions that form the basis for a poverty probability index (PPI) (https://www.povertyindex.org/country/kenya), which GiveDirectly uses to determine which households are eligible to receive cash transfers. GiveDirectly also records the exact geocoordinates of each household that they survey (Fig. 4G).需要和作者联系

 浙公网安备 33010602011771号