论文解析 -- Dapper, a Large-Scale Distributed Systems Tracing Infrastructure
作为distributed tracing的基石的paper
大部分内容,https://logz.io/blog/distributed-tracing-dapper-jaeger/
这个blog已经包含了
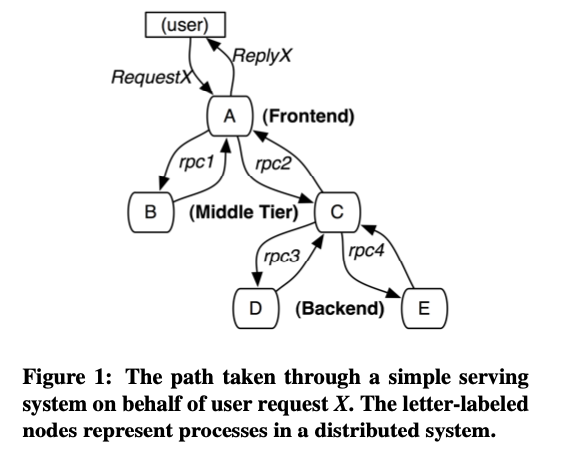
Dapper针对的场景,google作为搜索引擎,应对大量的网络请求,一个请求会通过rpc,访问多个remote或local的服务

Dapper的系统设计目的,
低损耗,应用透明,可扩展
很好理解
-
Low overhead: the tracing system should have negligible performance impact on running services.
In some highly optimized services even small monitoring overheads are easily noticeable, and might compel the deployment teams to turn the tracing system off. -
Application-level transparency: programmers should not need to be aware of the tracing system.
A tracing infrastructure that relies on active collaboration from application-level developers in order to function becomes extremely fragile (脆弱),
and is often broken due to instrumentation bugs or omissions, therefore violating the ubiquity requirement.
This is especially important in a fast-paced development environment such as ours. -
Scalability: it needs to handle the size of Google’s services and clusters for at least the next few years.
理解Dapper的关键,是理解这组概念,
Trace: The description of a transaction as it moves through a distributed system.
Span: A named, timed operation representing a piece of the workflow. Spans accept key: value tags as well as fine-grained, timestamped, structured logs attached to the particular span instance.
(Span) Context: Trace identifying information that accompanies the distributed transaction, including when it passes the service to service over the network or through a message bus. The span context contains the trace identifier, span identifier, and any other data that the tracing system needs to propagate to the downstream service.
Instrumentation: Instrumentation is the process through which your application’s code is extended to capture and report trace spans for the operations of interest.
Annotations: annotations(sometimes called baggage), allows the developer to enrich the trace with user-defined data, it can be used to save counters, relevant logs, and whatever data can help to investigate an incident.

一个完整的调用链,称为trace,通过traceid来跟踪;
trace中的一个调用段,称为span,span和span直接的关系,通过parent span id来维护;
context,就需要在各个span间传递的上下文,比如需要trace id,span id;
Instrumentation,一个capture and report trace spans的过程;
annotation,用于可以定义的随trace输出的内容,比如log,计数等,不然不指定,可以用默认内容,比如span name
架构图,分三步,也很直觉,
- Span data is written to a local log file
- Dapper collectors reading the traces from daemon on production machines
- Collectors writing the trace to a single Bigtable repository

Dapper很轻量,
总共1000多行代码,支持map的annotation,居然增加了500行
annotation不止一个,多个,比如,log,多个count等,所以用map实现
The core instrumentation is less than 1000 lines of code in C++ and under 800 lines in Java. The implementation of key-value annotations adds an additional 500 lines of code.
对于Overhead,分两块,trace generation and collection;
比较有效的是提到的adaptive sampling
这里的adaptive比较简单,就是看throughput,吞吐大的,采样率就会相应的降低,这里应该是有很多问题值得研究的
sampling,还支持在collection这步进一步的进行sampleing,按trace id sample,如果按span,数据就缺了,没法用
The cost of a tracing system is felt as performance degradation in the system being monitored
due to both trace generation and collection overheads, and as the amount of resources needed to store and analyze trace data.
blog最后提到的一下项目,和标准,有借鉴意义
The solutions can be grouped into 2 groups:
- Open Source Solutions
Zipkin (Twitter)
Jaeger (Uber)
AppDash
Skywalking - Enterprise Solutions
Amazon X-Ray
Google Cloud Trace
Datadog
Lightstep
New Relic
These are some, but not all of the solutions out there. This post won’t compare them, but I’ll just say that each one of the solutions has pros and cons, and the benefits depend on your architecture, language, and (mostly) the stack. Once you chose one, to avoid coupling to a specific solution during the instrumentation, multiple specs and standards raised:
W3 specification — defines standard HTTP headers and a value format to propagate context information.
OpenTracing — OpenTracing is comprised of an API specification, frameworks, and libraries that have implemented the specification, and documentation for the project.
OpenCensus — OpenCensus is a set of libraries for various languages that allow you to collect application metrics and distributed traces, then transfer the data to a backend of your choice in real-time.
OpenTelemetry — A collaboration between the creators of OpenTracing and OpenCensus, which is created to replace them with a unified specification with instrumentation libraries written in a variety of languages. OpenTracing is now an incubating project of CNCF (Cloud Native Computing Foundation).

 浙公网安备 33010602011771号