
Model Evaluation
1. Confusion Matrix
| Fact\Predict | Class A | Class B |
| Class A | True Positive | False Negative |
| Class B | False Positive | True Nagative |
A confusion table for Class A
Positive/ Negative: if target class is A, then the predict A is Positve, Others are negative.
True (P/N): if Predict = Fact, then it's True.
2. Measures based on Confusion Matrix
a. Accuracy = TN+TP/ALL
comments: not good measure when data are unbalanced.
b. True Positive Rate/ recall/ sensitivity = TP / TP + FN
comments: use it when Positive results are important
c. True Negative Rate = TN / TN + FP
comments: use it when Negative Results are important
R for Confusion Matrix:
library(SDMTools)
confusion.matrix(svmmodel.truth,svmmodel.class)
3. ROC curve (bio-classification)
y: sensitivity
x: specificity
The bigger the Area of ROC is, the more accurate the model is.
4. Normalized Weighted Root Mean Squared Logarithmic Error
Submissions are evaluated on the Normalized Weighted Root Mean Squared Logarithmic Error (NWRMSLE), calculated as follows:
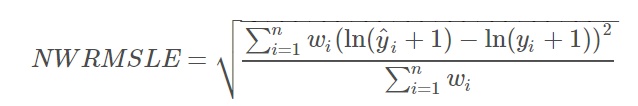
where for row i, y^iy^i is the predicted unit_sales of an item and yiyi is the actual unit_sales; n is the total number of rows in the test set.
The weights, wiwi, can be found in the items.csv file (see the Data page). Perishable items are given a weight of 1.25 where all other items are given a weight of 1.00.
This metric is suitable when predicting values across a large range of orders of magnitudes. It avoids penalizing large differences in prediction when both the predicted and the true number are large: predicting 5 when the true value is 50 is penalized more than predicting 500 when the true value is 545.
