
Matplotlib
在深度学习中,图形的绘制和数据的可视化非常重要。Matplotlib是用于绘制图形的库,使用Matplotlib可以轻松地绘制图形和实现数据的可视化。
1、绘制简单图形
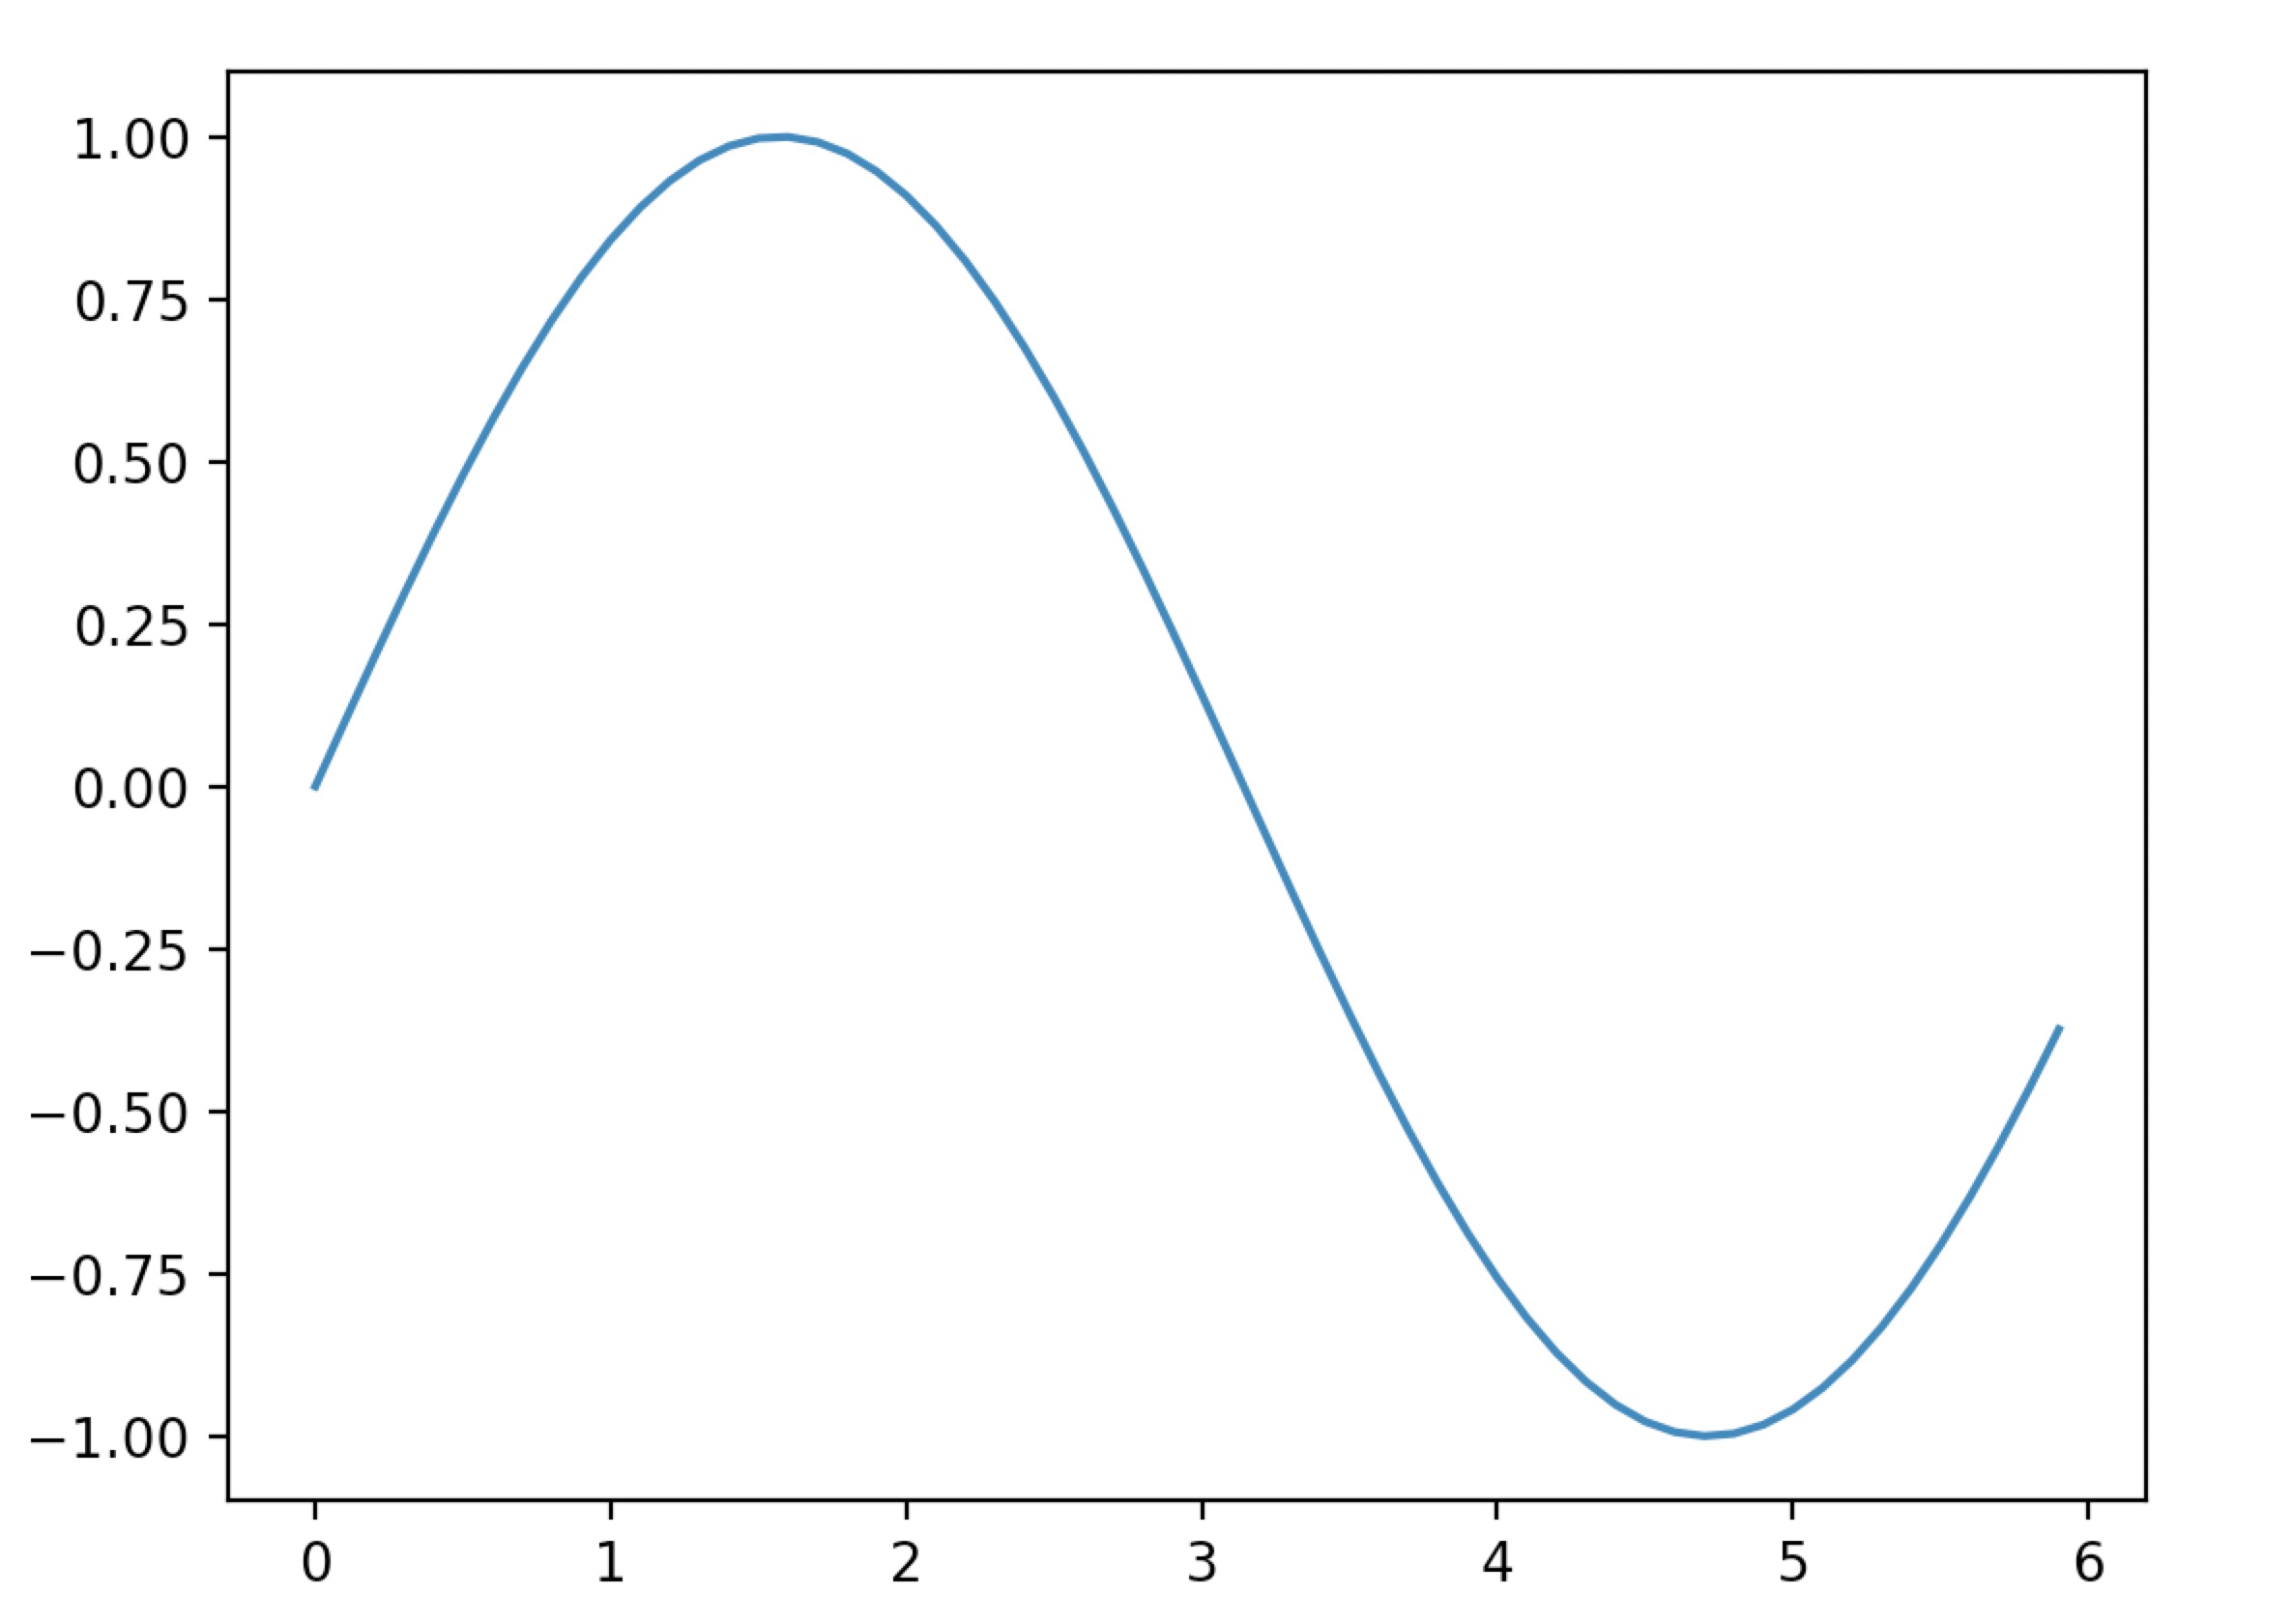
 1 import numpy as np
 2 import matplotlib.pyplot as plt
 3
 4 # 生成数据
 5 x = np.arange(0, 6, 0.1) # 以0.1为单位,生成0到6的数据
 6 y = np.sin(x) #对x的各个元素应用numpy的sin函数
 7
 8 # 绘制图形
 9 plt.plot(x, y)#将x,y的数据传给plt.plot方法
10 plt.show()#显示图形
图形如下
2、pyplot的功能
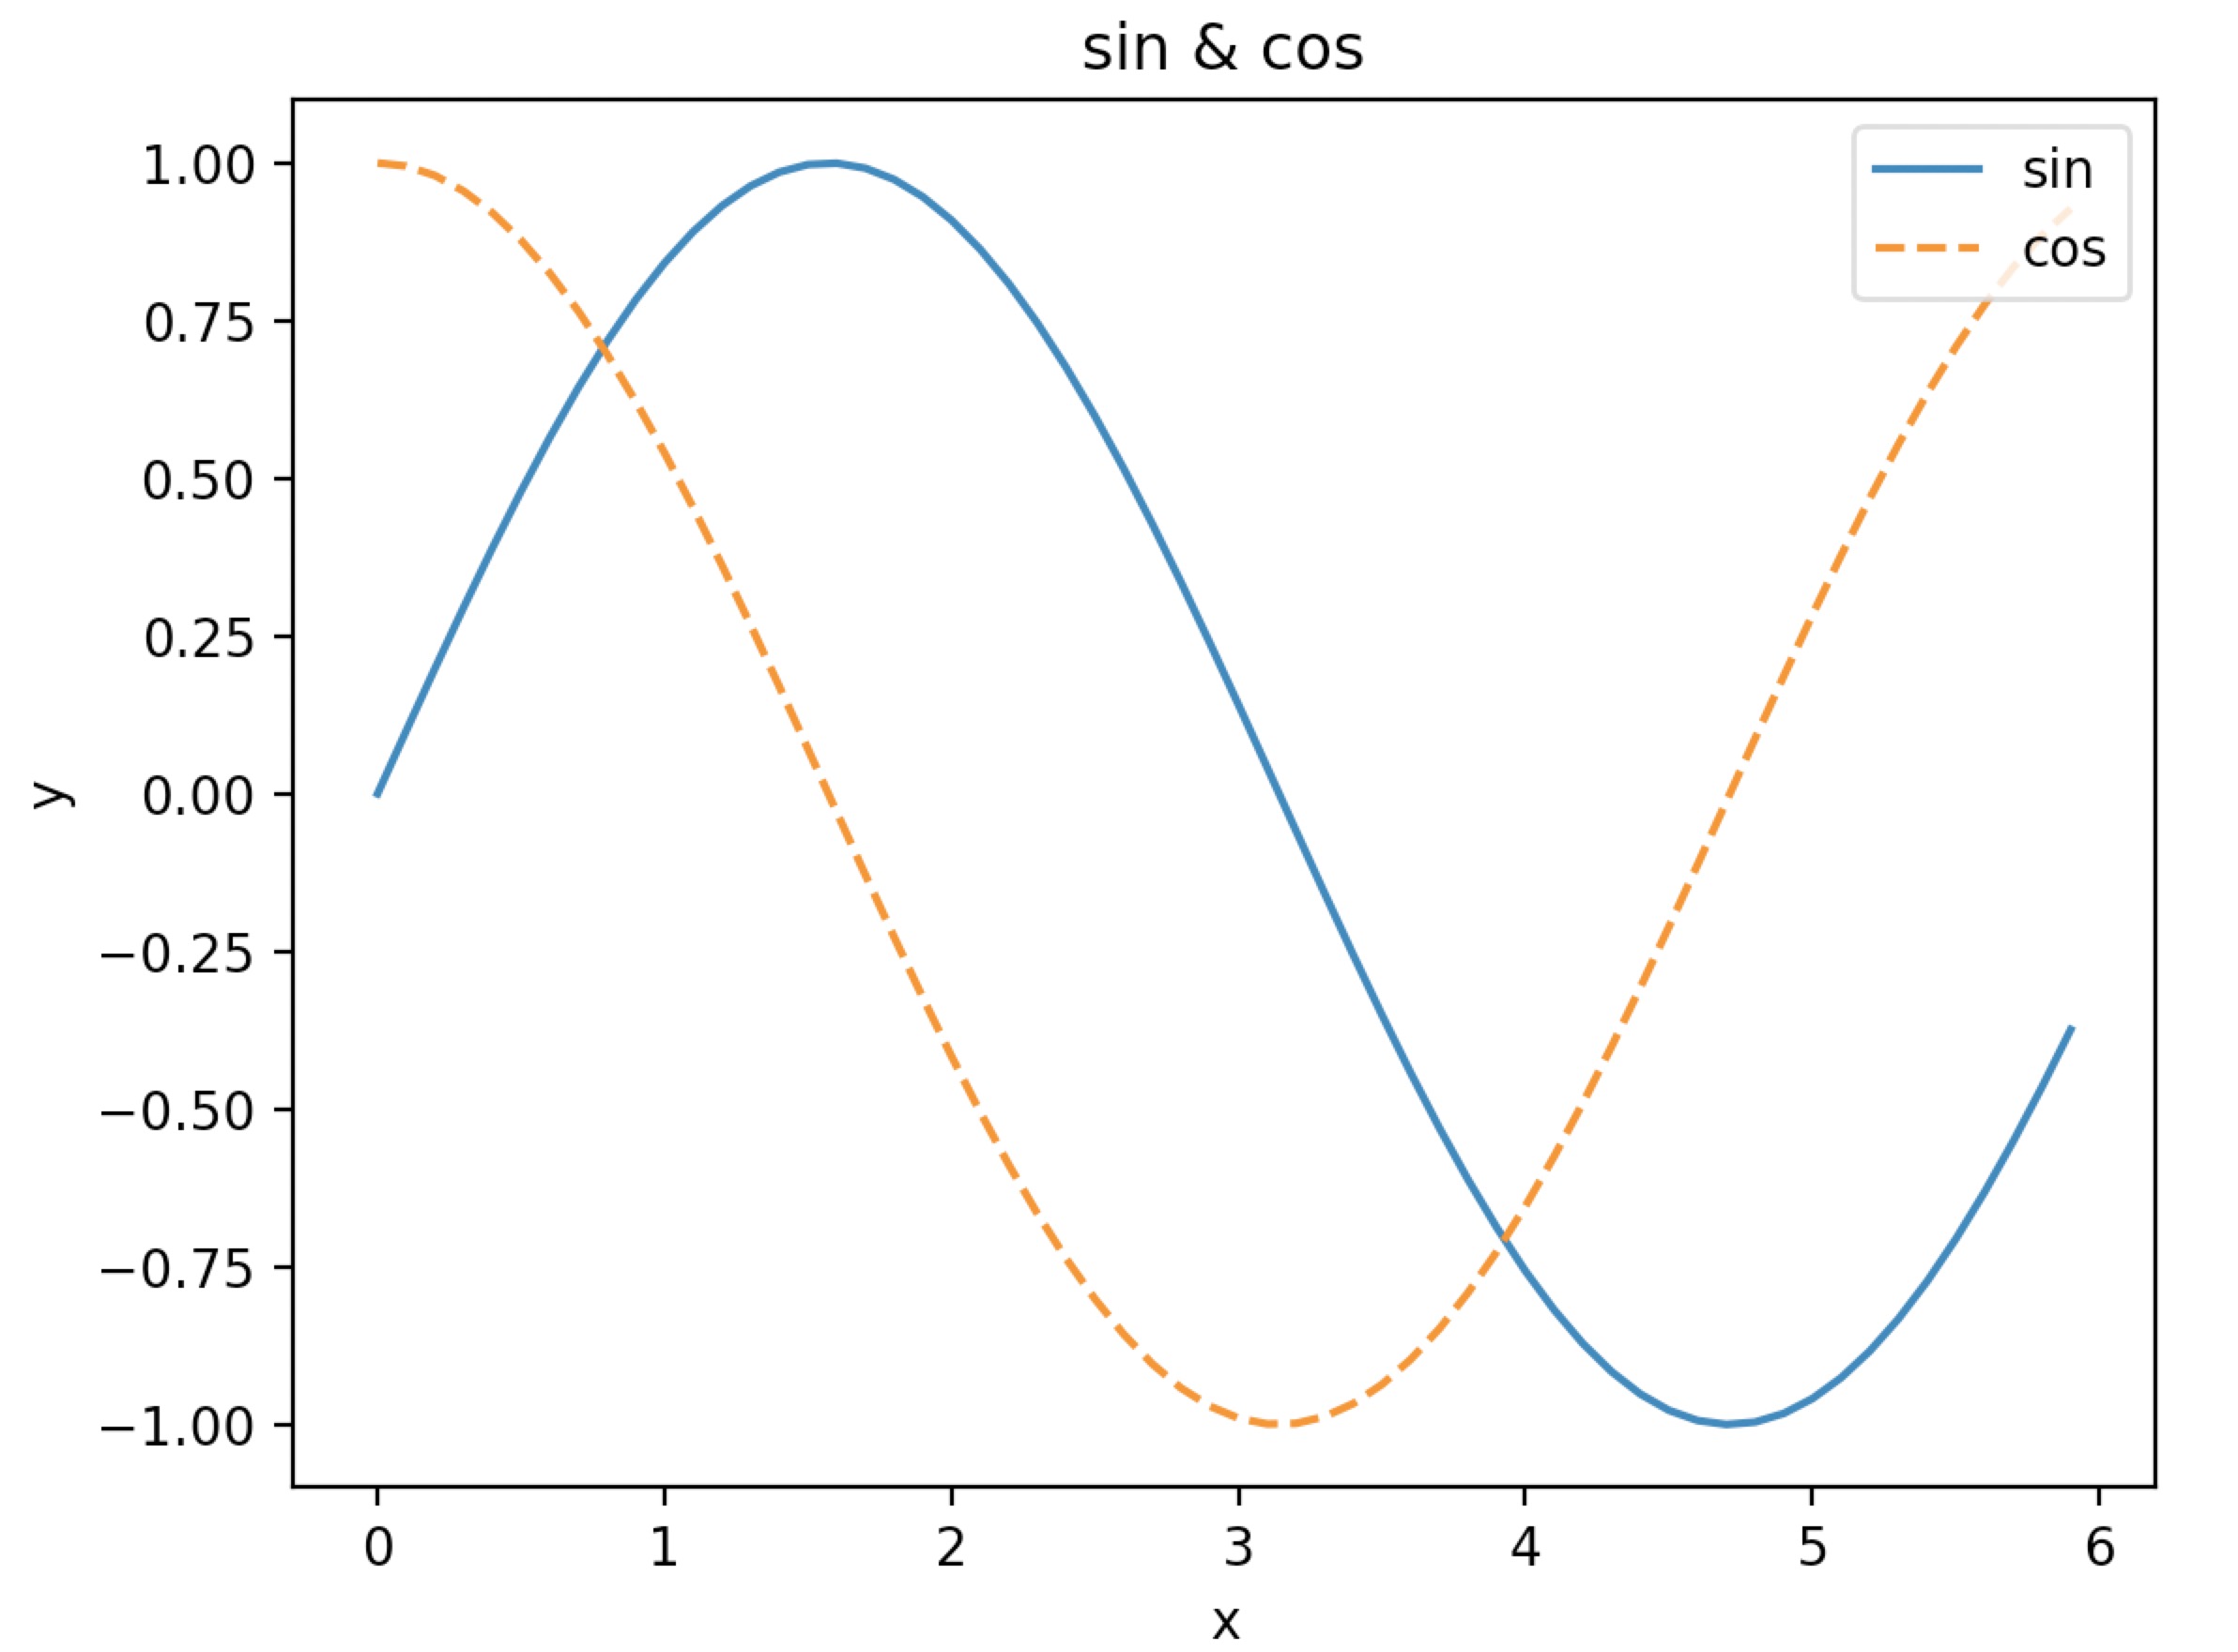
import numpy as np
import matplotlib.pyplot as plt

# 生成数据
x = np.arange(0, 6, 0.1) # 以0.1为单位,生成0到6的数据
y1 = np.sin(x)
y2 = np.cos(x)

# 绘制图形
plt.plot(x, y1, label="sin")
plt.plot(x, y2, linestyle = "--", label="cos") # 用虚线绘制
plt.xlabel("x") # x轴标签
plt.ylabel("y") # y轴标签
plt.title('sin & cos') # 标题
plt.legend(loc='upper right')  #显示图例(位置在右上角)
plt.show()
图形如下
3、显示图像
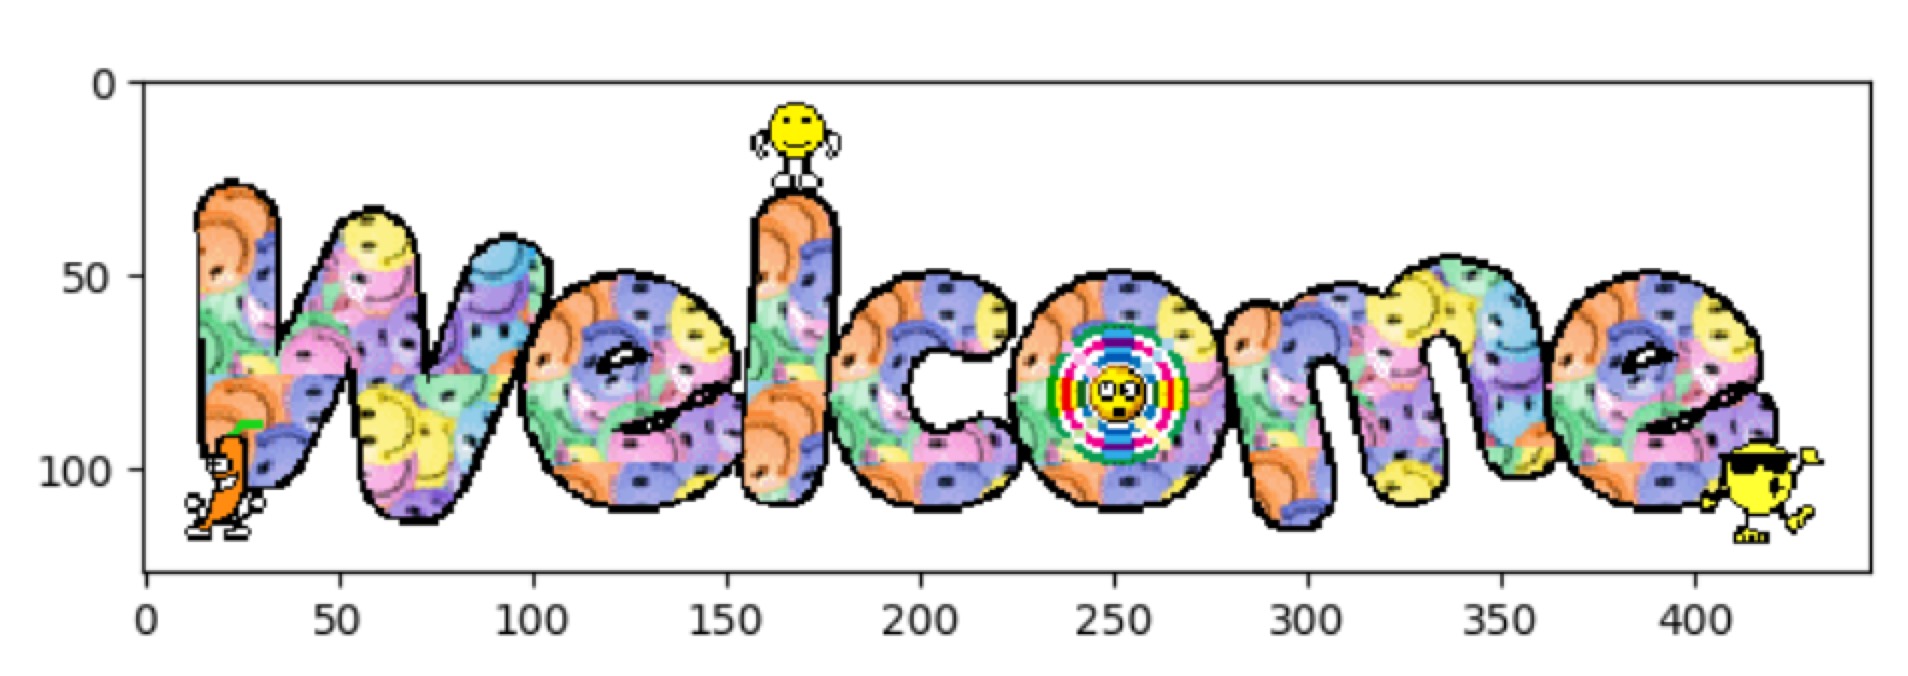
import matplotlib.pyplot as plt
from matplotlib.image import imread

img = imread('../dataset/welcome.gif') # 读入图像(设定合适的路径!)
plt.imshow(img)
plt.show()
显示如图:

 浙公网安备 33010602011771号