

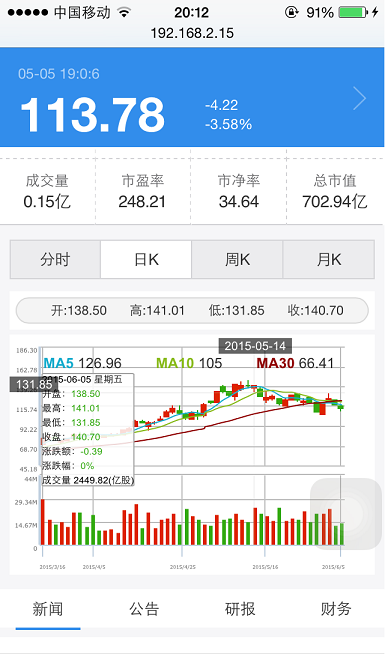
股票k线
与上一篇文章相比k线图主要的难点
1.tooltip的定制化显示:
当手指触摸手机屏幕上下拖动可能会手指的事件陷入图表无法进行上下拖动
tooltip:{followMouseMove}
followMouseMove为true的话手指左右移动框中数据会发生改变但是无法上下移动,false的话图表框可以上下移动但数据无法改变。
所以需要定制化tooltip,当手指上下移动的时候事件不会被捕获,左右移动的时候tooltip中的数据可以跟随变化。


 1 var tooltipChart = {//
 2         chartVar: null,//highcharts() 对象传入  在load时传入
 3         SVGElements: {},
 4         tooltipWidth:null,
 5         buildTooltip: function(text, coord,isLeft) {
 6             // we've to check if exists and remove it
 7             try {
 8                 this.SVGElements.destroy();
 9             } catch(e) {
10                 // nothing
11             }
12             try {
13                 // first of all we've to build a group to put the elements
14                 this.SVGElements = this.chartVar.renderer.g().attr({'zIndex': 11}).add();
15                 //将tooltip放在左边  coord[0] 左坐标位置正确的,coord[1]传入的是图表高度
16                 // build tooltip text
17                 var textContainer = this.chartVar.renderer.text(text, coord[0],coord[1])
18                     .attr({
19                         'zIndex': 10
20                     })
21                     .add(this.SVGElements);
22                 // get text 'box'
23                 var box = textContainer.getBBox();
24                 tooltipChart.tooltipWidth=box.width;
25                 // build  tooltip square according to the text location, then place the container behind the text
26                 this.chartVar.renderer.rect(box.x , box.y, box.width , box.height , 1)
27                     .attr({
28                         'stroke-width': 1,            // border width
29                         'stroke': '#a8a8a8',        // border color
30                         'zIndex': 9,
31                         'fill': 'white',            // background color
32                         'fill-opacity': 0.85,        // background opacity
33                         'isShadow': false
34                     })
35                     .add(this.SVGElements);
36             } catch(e) {
37                 return false;
38             }
39         }
40     }
2.蜡烛的形状以及源码改写
 1  //修改colum条的颜色(重写了源码方法)
 2      var originalDrawPoints = Highcharts.seriesTypes.column.prototype.drawPoints;
 3         Highcharts.seriesTypes.column.prototype.drawPoints = function () {
 4             var merge  = Highcharts.merge,
 5                 series = this,
 6                 chart  = this.chart,
 7                 points = series.points,
 8                 i      = points.length;
 9             var seriesPointAttr ;
10             while (i--) {
11                 var candlePoint = chart.series[0].points[i];
12                 if(candlePoint.open != undefined && candlePoint.close !=  undefined){  //如果是K线图 改变矩形条颜色,否则不变
13                     var color = (candlePoint.open < candlePoint.close) ? '#DD2200' : '#33AA11';
14                     seriesPointAttr = merge(series.pointAttr);
15                     seriesPointAttr[''].fill = color;
16                     seriesPointAttr.hover.fill = Highcharts.Color(color).brighten(0.3).get();
17                     seriesPointAttr.select.fill = color;
18                 }else{
19                      seriesPointAttr = merge(series.pointAttr);
20                 }
21                 points[i].pointAttr = seriesPointAttr;
22             }
23             originalDrawPoints.call(this);
24         };
3.MA5、 MA10、MA30的显示
可以借助addPlotBand在x轴上label中写入数据
代码:
以下html来触发样式点击
 1     <ul class="clearfix">
 2                 <li class="hover">
 3                     <a href="javascript:void(0);" onclick="clickTrend(this)">分时</a>
 4                 </li>
 5                 <li>
 6                     <a href="javascript:void(0);" onclick="clickDayKLine(this)">日K</a>
 7                 </li>
 8                 <li>
 9                     <a href="javascript:void(0);" onclick="clickWeekKLine(this)">周K</a>
10                 </li>
11                 <li>
12                     <a href="javascript:void(0);" onclick="clickMonthKLine(this)">月K</a>
13                 </li>
14             </ul>
引入jquery.js highstock.js
html
1 <div id="report" class="klineMap-report"></div>
2 <div class="kline_map" id="line_map" style="height: 200px;width: 100%" >
kline_chart.js
1 //open.hundsun.com:8081/quote/v1/kline?get_type=range&prod_code=600570.SS&candle_period=6&fields=open_px,high_px,low_px,close_px,business_amount&data_count=5 2 var KLINE_URL=js_lib.getkLineUrl(); 3 var DIVID="#line_map"; 4 //接收个股代码 5 var STOCK_CODE = js_lib.getQueryStringByName("stock_code"); 6 var STOCKCODE="600570.SS"; 7 if(STOCK_CODE==""){ 8 STOCK_CODE="600570.SS"; 9 } 10 //日K 11 function clickDayKLine(obj){ 12 var kline_params = "get_type=range&prod_code="+STOCK_CODE+"&candle_period=6&fields=open_px,high_px,low_px,close_px,business_amount"; 13 js_lib.ajax(KLINE_URL, clickKLine_Show, 'get',kline_params,failCallback); 14 15 $(obj).parent().parent().children().each(function(){ 16 $(this).removeClass("hover"); 17 }); 18 $(obj).parent().addClass("hover"); 19 } 20 21 //周K 22 function clickWeekKLine(obj){ 23 var kline_params = "get_type=range&prod_code="+STOCK_CODE+"&candle_period=7&fields=open_px,high_px,low_px,close_px,business_amount"; 24 js_lib.ajax(KLINE_URL, clickKLine_Show, 'get',kline_params,failCallback); 25 $(obj).parent().parent().children().each(function(){ 26 $(this).removeClass("hover"); 27 }); 28 $(obj).parent().addClass("hover"); 29 } 30 //月k 31 function clickMonthKLine(obj){ 32 var kline_params = "get_type=range&prod_code="+STOCK_CODE+"&candle_period=8&fields=open_px,high_px,low_px,close_px,business_amount"; 33 js_lib.ajax(KLINE_URL, clickKLine_Show, 'get',kline_params,failCallback); 34 $(obj).parent().parent().children().each(function(){ 35 $(this).removeClass("hover"); 36 }); 37 $(obj).parent().addClass("hover"); 38 39 } 40 //年K 41 function clickYearKLine(obj){ 42 var kline_params = "get_type=range&prod_code="+STOCK_CODE+"&candle_period=9&fields=open_px,high_px,low_px,close_px,business_amount&data_count=5"; 43 js_lib.ajax(KLINE_URL, clickKLine_Show, 'get',kline_params,failCallback); 44 $(obj).parent().parent().children().each(function(){ 45 $(this).removeClass("hover"); 46 }); 47 $(obj).parent().addClass("hover"); 48 } 49 50 function clickKLine_Show(val){ 51 var jsonText = JSON.parse(val); 52 if(typeof(jsonText.error_info)!='undefined'){ 53 failCallback(); 54 return ; 55 } 56 data=jsonText.data.candle; 57 data=data[STOCK_CODE]; 58 createKlineChart(DIVID,data); 59 } 60 //定制化 tooltip 61 var tooltipChart = {// 62 chartVar: null,//highcharts() 对象传入 在load时传入 63 SVGElements: {}, 64 tooltipWidth:null, 65 buildTooltip: function(text, coord,isLeft) { 66 // we've to check if exists and remove it 67 try { 68 this.SVGElements.destroy(); 69 } catch(e) { 70 // nothing 71 } 72 try { 73 // first of all we've to build a group to put the elements 74 this.SVGElements = this.chartVar.renderer.g().attr({'zIndex': 11}).add(); 75 //将tooltip放在左边 coord[0] 左坐标位置正确的,coord[1]传入的是图表高度 76 // build tooltip text 77 var textContainer = this.chartVar.renderer.text(text, coord[0],coord[1]) 78 .attr({ 79 'zIndex': 10 80 }) 81 .add(this.SVGElements); 82 // get text 'box' 83 var box = textContainer.getBBox(); 84 tooltipChart.tooltipWidth=box.width; 85 // build tooltip square according to the text location, then place the container behind the text 86 this.chartVar.renderer.rect(box.x , box.y, box.width , box.height , 1) 87 .attr({ 88 'stroke-width': 1, // border width 89 'stroke': '#a8a8a8', // border color 90 'zIndex': 9, 91 'fill': 'white', // background color 92 'fill-opacity': 0.85, // background opacity 93 'isShadow': false 94 }) 95 .add(this.SVGElements); 96 } catch(e) { 97 return false; 98 } 99 } 100 } 101 //放数据个数控制 102 var count=0; 103 //highstock K线图 104 var createKlineChart = function (divID,data,crrentData){ 105 var $reporting = $("#report"); 106 $reporting.html(""); 107 var firstTouch = true; 108 //开盘价^最高价^最低价^收盘价^成交量^成交额^涨跌幅^换手率^五日均线^十日均线^30日均线^昨日收盘价 109 var open,high,low,close,y,zde,zdf,MA5=0,MA10=0,MA30=0,zs=0; 110 //定义数组 111 var ohlcArray = [],volumeArray = [],MA5Array = [],MA10Array=[],MA30Array=[]; 112 //容错处理 113 if(data==undefined&&data==null&&data.length==0){ 114 failCallback(); 115 return; 116 } 117 //修改colum条的颜色(重写了源码方法) 118 var originalDrawPoints = Highcharts.seriesTypes.column.prototype.drawPoints; 119 Highcharts.seriesTypes.column.prototype.drawPoints = function () { 120 var merge = Highcharts.merge, 121 series = this, 122 chart = this.chart, 123 points = series.points, 124 i = points.length; 125 var seriesPointAttr ; 126 while (i--) { 127 var candlePoint = chart.series[0].points[i]; 128 if(candlePoint.open != undefined && candlePoint.close != undefined){ //如果是K线图 改变矩形条颜色,否则不变 129 var color = (candlePoint.open < candlePoint.close) ? '#DD2200' : '#33AA11'; 130 seriesPointAttr = merge(series.pointAttr); 131 seriesPointAttr[''].fill = color; 132 seriesPointAttr.hover.fill = Highcharts.Color(color).brighten(0.3).get(); 133 seriesPointAttr.select.fill = color; 134 }else{ 135 seriesPointAttr = merge(series.pointAttr); 136 } 137 points[i].pointAttr = seriesPointAttr; 138 } 139 originalDrawPoints.call(this); 140 }; 141 //常量本地化 142 Highcharts.setOptions({ 143 global : { 144 useUTC : true 145 }, 146 lang: { 147 rangeSelectorFrom:"日期:", 148 rangeSelectorTo:"至", 149 rangeSelectorZoom:"间隔", 150 loading:'加载中...', 151 shortMonths:['1月','2月','3月','4月','5月','6月','7月','8月','9月','10月','11月','12月'], 152 weekdays:['星期日', '星期一', '星期二', '星期三', '星期四', '星期五', '星期六'], 153 }}); 154 //格式化数据,准备绘图 ,把当前最新K线数据加载进来,count至多50个数据 155 count = data.length<50?data.length:50; 156 //限制数据输入个数 157 var i; 158 for (i = data.length-count; i <data.length; i++) { 159 //日期的原始格式 20141205,转换成highstock的日期格式 160 var dateUTC = getDateUTC(data[i][0]);//得出的UTC时间 161 ohlcArray.push([ 162 parseInt(dateUTC), // the date 163 parseFloat(data[i][1]), // open 164 parseFloat(data[i][2]), // high 165 parseFloat(data[i][3]), // low 166 parseFloat(data[i][4]) // close 167 ]); 168 if(i>=4){ 169 var ma5=0.00; 170 for( var j=0;j<5;j++){ 171 ma5+=parseFloat(data[i-j][4]); 172 } 173 MA5Array.push([ 174 parseInt(dateUTC), // the date 175 parseFloat(ma5/5) 176 ]); 177 } 178 if(i>=9){ 179 var ma10=0.00; 180 for( var j=0;j<10;j++){ 181 ma10+=parseFloat(data[i-j][4]); 182 } 183 MA10Array.push([ 184 parseInt(dateUTC), 185 parseFloat(ma10/10), 186 ]); 187 } 188 if(i>=29){ 189 var ma30=0.00; 190 for( var j=0;j<30;j++){ 191 ma30+=parseFloat(data[i-j][4]); 192 } 193 MA30Array.push([ 194 parseInt(dateUTC), 195 parseFloat(ma30/30) 196 ]); 197 } 198 volumeArray.push([ 199 parseInt(dateUTC), // the date 200 parseInt(data[i][5]) // 成交量 201 ]); 202 203 } 204 var swipeX=false,//左右移动标志 205 swipeY=false;//上下移动标志 206 //触屏触摸 207 createKlineChart.kline_touchstart=function(event){ 208 var touch = event.touches[0]; 209 startX=touch.pageX; 210 startY=touch.pageY; 211 swipeX=swipeY=false; 212 document.getElementById("line_map").addEventListener("touchmove", createKlineChart.kline_touchmove); 213 } 214 //触屏手指移动 215 createKlineChart.kline_touchmove=function(event){ 216 var touch = event.touches[0]; 217 var currenX=touch.pageX; 218 var currentY=touch.pageY; 219 var chart = $(DIVID).highcharts(); 220 221 if(true==swipeX){//先左右就一直左右 上下也不影响 222 swipeY=false; 223 } 224 else if(true==swipeY){//向上下移动的标志 225 swipeX=false; 226 }else{ 227 if(Math.abs(currentY-startY)>Math.abs(currenX-startX)){//判断上下移动 228 swipeY=true; 229 } 230 else{ 231 swipeX=true; 232 } 233 } 234 if(true==swipeY){//上下移动 x 先重画线 然后删除事件 235 document.getElementById("line_map").removeEventListener("touchmove", createKlineChart.kline_touchmove,false); 236 }else if(true==swipeX){ 237 event.preventDefault(); 238 } 239 //不管 上下 还是 左右 都需要先画标示线 240 //画图区左边距离 241 var left=chart.yAxis[0].left+(chart.yAxis[0].axisLine.strokeWidth==undefined?0:chart.yAxis[0].axisLine.strokeWidth); 242 var y ; 243 var x = touch.pageX-left-10; 244 //x点 =x/chart宽度 * 总体点的个数 245 x=(x/chart.plotWidth)*ohlcArray.length; 246 var i=0; 247 i=Number(Math.ceil(x)); 248 if(i>=ohlcArray.length||i<0){ 249 return;} 250 //计算图表x轴 251 x=ohlcArray[i][0];//utc格式时间数据 252 y=ohlcArray[i][3]; 253 chart = $(DIVID).highcharts(); // Highcharts构造函数 254 chart.xAxis[0].removePlotBand("plotBand-x"); 255 chart.xAxis[0].addPlotBand({ 256 borderColor:'#BEBEBE', 257 borderWidth:0.1, 258 color: '#BEBEBE', 259 from: x-0.0001,//,Date.UTC(2015, 3, 27,10,50), 260 to: x+0.0001,//Date.UTC(2015, 3, 27,10,51), 261 label: { 262 useHTML:true, 263 text: '<span class="value" style="font-size:10px;background-color:rgba(0,0,0,.6); color:#fff; height:15px; line-height:15px; padding:0 5px;">'+Highcharts.dateFormat('%Y-%m-%d ', x)+'</span>', 264 textAlign: 'bottom', 265 x:-30, 266 y:5 267 }, 268 id:'plotBand-x', 269 zIndex:1001 270 }); 271 chart.yAxis[0].removePlotBand("plotBand-y0"); 272 chart.yAxis[0].addPlotBand({ 273 borderColor:'#BEBEBE', 274 borderWidth:0.1, 275 color: '#BEBEBE', 276 from: y-0.0001,//,Date.UTC(2015, 3, 27,10,50), 277 to: y+0.0001,//Date.UTC(2015, 3, 27,10,51), 278 label: { 279 useHTML:true, 280 text: '<span class="value" style="font-size:10px;background-color:rgba(0,0,0,.6); color:#fff; height:15px; line-height:15px; padding:0 5px;">'+y.toFixed(2)+'</span>', 281 verticalAlign:'left', 282 textAlign: 'left', 283 x:-25, 284 y:-2 285 }, 286 id:'plotBand-y0', 287 zIndex:1001 288 }); 289 var open=0,high=0,low=0,close=0,MA5=0,MA10=0,MA30=0; 290 if(ohlcArray.length>0){ 291 open=Number(ohlcArray[i][1].toFixed(2)); 292 high=Number(ohlcArray[i][2].toFixed(2)); 293 low=Number(ohlcArray[i][3].toFixed(2)); 294 close=Number(ohlcArray[i][4].toFixed(2)); 295 if(i>=4){ 296 MA5=Number(MA5Array[i-4][1].toFixed(2)); 297 } 298 if(i>=9){ 299 MA10=Number(MA10Array[i-9][1].toFixed(2)); 300 } 301 if(i>=29){ 302 MA30=Number(MA30Array[i-29][1].toFixed(2)); 303 } 304 } 305 $reporting.html( 306 '<div class="detail">'+ 307 '<ul>'+ 308 '<li class="value-4">'+ 309 ' <span>开:</span>'+ open.toFixed(2) 310 +'</li>' 311 +'<li>' 312 +' <span>高:</span>'+ high.toFixed(2) 313 +'</li>' 314 +'<li>' 315 +' <span>低:</span>'+ low.toFixed(2) 316 +'</li>' 317 +'<li>' 318 +'<span>收:</span>'+close.toFixed(2) 319 +'</li>' 320 +'</ul>' 321 +'</div>' 322 ); 323 chart.xAxis[0].removePlotBand("plotBand-whole-x"); 324 chart.xAxis[0].addPlotBand({ 325 borderColor:'transparent', 326 borderWidth:1, 327 color: 'transparent', 328 from: ohlcArray[0][0]-0.00001,//,Date.UTC(2015, 3, 27,10,50), 329 to: ohlcArray[0][0]+0.000001,//Date.UTC(2015, 3, 27,10,51), 330 label: { 331 useHTML:true, 332 text:'<p>' 333 + ' <b style="color:#1aadce;padding-left:25px">MA5</b> '+ MA5 334 +' <b style="color: #8bbc21;padding-left:25px">MA10 </b> '+ MA10 335 +' <b style="color:#910000;padding-left:25px">MA30</b> '+ MA30 336 +'</p>' , 337 textAlign: 'top', 338 y:20, 339 x:-25 340 }, 341 id:'plotBand-whole-x', 342 zIndex:1001 343 }); 344 345 //左右移动,显示tooltip关联tooltipChart对象 346 var coord=null ; 347 //手指在图表中间的右侧 348 if(i>ohlcArray.length/2){ 349 coord = [left,chart.yAxis[0].top+30]; 350 }else{ 351 coord=[chart.chartWidth-left-tooltipChart.tooltipWidth,chart.yAxis[0].top+30]; 352 } 353 var text = getTooltipHTML(ohlcArray,volumeArray,i); 354 tooltipChart.buildTooltip(text, coord); 355 } 356 document.getElementById("line_map").removeEventListener("touchstart",createTrendChart.trend_touchstart,false); 357 document.getElementById("line_map").addEventListener("touchstart",createKlineChart.kline_touchstart); 358 document.getElementById("line_map").removeEventListener("touchmove",createTrendChart.trend_touchmove,false); 359 //开始绘图 360 $(DIVID).highcharts('StockChart', { 361 chart:{ 362 renderTo : DIVID, 363 //关闭平移 364 panning:false, 365 zoomType: 'none', 366 pinchType:'none', 367 //修改左右位置 368 margin: [10, 25,25, 25], 369 spacing: [0,0,0,0], 370 plotBorderColor: '#3C94C4', 371 plotBorderWidth: 0, 372 zoomType:false, 373 events:{ 374 load:function(){ 375 x=ohlcArray[ohlcArray.length-1][0]; 376 y=ohlcArray[ohlcArray.length-1][3]; 377 var chart = $(DIVID).highcharts(); // Highcharts构造函数 378 //时间线 379 chart.xAxis[0].removePlotBand("plotBand-x"); 380 chart.xAxis[0].addPlotBand({ 381 borderColor:'#BEBEBE', 382 borderWidth:0.1, 383 color: '#BEBEBE', 384 from: x-0.0001,//,Date.UTC(2015, 3, 27,10,50), 385 to: x+0.0001,//Date.UTC(2015, 3, 27,10,51), 386 label: { 387 useHTML:true, 388 text: '<span class="value" style="font-size:10px;background-color:rgba(0,0,0,.6); color:#fff; height:15px; line-height:15px; padding:0 5px;">'+Highcharts.dateFormat('%Y-%m-%d ', x)+'</span>', 389 textAlign: 'bottom', 390 y:5, 391 x:-30 392 }, 393 id:'plotBand-x', 394 zIndex:1001 395 }); 396 chart.yAxis[0].removePlotBand("plotBand-y0"); 397 chart.yAxis[0].addPlotBand({ 398 borderColor:'#BEBEBE', 399 borderWidth:0.1, 400 color: '#BEBEBE', 401 from: y-0.0001,//,Date.UTC(2015, 3, 27,10,50), 402 to: y+0.0001,//Date.UTC(2015, 3, 27,10,51), 403 label: { 404 useHTML:true, 405 text: '<span class="value" style="font-size:10px;background-color:rgba(0,0,0,.6); color:#fff; height:15px; line-height:15px; padding:0 5px;">'+y.toFixed(2)+'</span>', 406 verticalAlign:'left', 407 textAlign: 'left', 408 x:-25, 409 y:-2 410 }, 411 id:'plotBand-y0', 412 zIndex:1001 413 }); 414 var open=0,high=0,low=0,close=0,MA5=0,MA10=0,MA30=0; 415 if(ohlcArray.length>0){ 416 open=Number(ohlcArray[ohlcArray.length-1][1].toFixed(2)); 417 high=Number(ohlcArray[ohlcArray.length-1][2].toFixed(2)); 418 low=Number(ohlcArray[ohlcArray.length-1][3].toFixed(2)); 419 close=Number(ohlcArray[ohlcArray.length-1][4].toFixed(2)); 420 if(ohlcArray.length>=5-1){ 421 MA5=Number(MA5Array[MA5Array.length-1][1].toFixed(2)); 422 } 423 if(ohlcArray.length>=10-1){ 424 MA10=Number(MA10Array[MA10Array.length-1][1].toFixed(2)); 425 } 426 if(ohlcArray.length>=30-1){ 427 MA30=Number(MA30Array[MA30Array.length-1][1].toFixed(2)); 428 } 429 } 430 $reporting.html( 431 '<div class="detail">'+ 432 '<ul>'+ 433 '<li class="value-4">'+ 434 ' <span>开:</span>'+ open.toFixed(2) 435 +'</li>' 436 +'<li>' 437 +' <span>高:</span>'+ high.toFixed(2) 438 +'</li>' 439 +'<li>' 440 +' <span>低:</span>'+ low.toFixed(2) 441 +'</li>' 442 +'<li>' 443 +'<span>收:</span>'+close.toFixed(2) 444 +'</li>' 445 +'</ul>' 446 +'</div>' 447 ); 448 chart.xAxis[0].removePlotBand("plotBand-whole-x"); 449 chart.xAxis[0].addPlotBand({ 450 borderColor:'transparent', 451 borderWidth:1, 452 color: 'transparent', 453 from: ohlcArray[0][0]-0.000001,//,Date.UTC(2015, 3, 27,10,50), 454 to: ohlcArray[0][0]+0.000001,//Date.UTC(2015, 3, 27,10,51), 455 label: { 456 useHTML:true, 457 text:'<p>' 458 + ' <b style="color:#1aadce;padding-left:25px">MA5</b> '+ MA5 459 +' <b style="color: #8bbc21;padding-left:25px">MA10 </b> '+ MA10 460 +' <b style="color:#910000;padding-left:25px">MA30</b> '+ MA30 461 +'</p>' , 462 textAlign: 'top', 463 y:20, 464 x:-25 465 }, 466 id:'plotBand-whole-x', 467 zIndex:1001 468 }); 469 //显示tooltip 470 var chart = $(DIVID).highcharts(); 471 var left=chart.yAxis[0].left+(chart.yAxis[0].axisLine.strokeWidth==undefined?0:chart.yAxis[0].axisLine.strokeWidth); 472 473 //关联tooltipChart对象 474 tooltipChart.chartVar=chart; 475 var coord = [left,chart.yAxis[0].top+30]; 476 var text = getTooltipHTML(ohlcArray,volumeArray,ohlcArray.length-1); 477 $textDiv=$(text); 478 tooltipChart.buildTooltip(text, coord); 479 } 480 } 481 482 }, 483 484 loading: { 485 labelStyle: { 486 position: 'relative', 487 top: '10em', 488 zindex:1000 489 } 490 }, 491 credits:{ 492 enabled:false 493 }, 494 rangeSelector: { 495 enabled:false 496 }, 497 plotOptions: { 498 //修改蜡烛颜色 499 candlestick: { 500 color: '#33AA11', 501 upColor: '#DD2200', 502 lineColor: '#33AA11', 503 upLineColor: '#DD2200', 504 maker:{ 505 enabled:false, 506 states:{ 507 hover:{ 508 enabled:false, 509 } 510 } 511 }, 512 // cursor: 'pointer', 513 dataLabels: { 514 enabled: false, 515 516 // y:-100 517 } 518 }, 519 //去掉曲线和蜡烛上的hover事件 520 series: { 521 states: { 522 hover: { 523 enabled: false 524 } 525 }, 526 line: { 527 marker: { 528 enabled: false 529 } 530 }, 531 }, 532 column:{ 533 //启用动画 534 animation:true, 535 states: { 536 hover: { 537 enabled: false 538 } 539 }, 540 }, 541 spline:{ 542 allowPointSelect:false, 543 states: { 544 hover: { 545 enabled: false 546 } 547 }, 548 }, 549 550 }, 551 //格式化悬浮框 552 tooltip: { 553 enabled:false, 554 crosshairs:false, 555 }, 556 title: { 557 enabled:false 558 }, 559 exporting: { 560 enabled: false //设置导出按钮不可用 561 }, 562 scrollbar: { 563 enabled:false 564 }, 565 navigator: { 566 enabled:false, 567 }, 568 xAxis:{ 569 showFirstLabel: true, 570 showLastLabel:true, 571 labels: { 572 overflow: 'justify', 573 style: { //字体样式 574 font: 'normal 4px Verdana, sans-serif' 575 }, 576 formatter: function() { 577 var vDate=new Date(this.value); 578 return vDate.getFullYear()+"/"+(vDate.getMonth()+1)+"/"+vDate.getDate(); 579 }, 580 align: 'center' 581 } , 582 583 gridLineWidth: 1, 584 // X轴的步进值,决定隔多少个显示一个 585 tickPositioner:function(){ 586 var positions = [], 587 tick = Number((this.dataMin)), 588 increment = Number(((this.dataMax - this.dataMin) / 4)); 589 for (tick; tick - increment <= this.dataMax; tick += increment) { 590 positions.push(Number(tick.toFixed(2))); 591 if(increment==0){ 592 break; 593 } 594 } 595 return positions; 596 }, 597 }, 598 yAxis: [{ 599 title: { 600 text: '' 601 }, 602 labels: { 603 overflow: 'justify', 604 style: { //字体样式 605 font: 'normal 5px Verdana, sans-serif' 606 }, 607 align: 'right', 608 x:-2, 609 y:5, 610 formatter: function() { 611 return this.value.toFixed(2); 612 }, 613 }, 614 //tickInterval: 10, 615 showFirstLabel: true, 616 showLastLabel:true, 617 height: '60%', 618 lineWidth:2,//Y轴边缘线条粗细 619 opposite:false, 620 tickPositioner:function(){ 621 var positions = [], 622 tickMin=Number(this.dataMin), 623 tickMax=Number(this.dataMax), 624 tick , 625 increment = Number(((tickMax-tickMin) / 5).toFixed(2)); 626 tickMin=tickMin-increment; 627 tickMax=tickMax+increment; 628 increment= Number(((tickMax-tickMin) / 5).toFixed(2)); 629 tick=tickMin; 630 if(tick<0){ 631 tick=0; 632 tickMin=0; 633 tickMax=tickMax+(-tick); 634 increment=tickMax/5; 635 } 636 var j=0; 637 for (tick;j++<=6 &&increment!=0; tick =Number(tick+ increment)) { 638 positions.push(Number(tick.toFixed(2))); 639 } 640 return positions; 641 }, 642 },{ 643 title: { 644 text:'' 645 }, 646 showFirstLabel: true, 647 showLastLabel:true, 648 labels: { 649 style: { //字体样式 650 font: 'normal 5px Verdana, sans-serif' 651 }, 652 align: 'right', 653 x: -2, 654 y:5, 655 formatter:function(){ 656 if(this.value>1000000000){ 657 return Number((this.value/1000000000).toFixed(2))+"G"; 658 }else if(this.value>1000000){ 659 return Number((this.value/1000000).toFixed(2))+"M"; 660 }else if(this.value>1000){ 661 return Number((this.value/1000).toFixed(2))+"K"; 662 }else{ 663 return Number(this.value.toFixed(2)); 664 } 665 } 666 }, 667 top: '65%', 668 height: '35%', 669 offset:0, 670 lineWidth: 2, 671 opposite:false, 672 tickPositioner:function(){ 673 var positions = [], 674 tick = Number((this.dataMin)), 675 increment = Number(((this.dataMax - this.dataMin) / 2)); 676 for (tick; tick - increment <= this.dataMax; tick += increment) { 677 positions.push(Number(tick.toFixed(2))); 678 if(0==increment){break;} 679 } 680 return positions; 681 } 682 }], 683 series: [ 684 { 685 type: 'candlestick', 686 id:"candlestick", 687 name: STOCK_CODE, 688 data: ohlcArray, 689 tooltip : { 690 valueDecimals : 2 691 }, 692 dataGrouping: { 693 enabled: false, 694 forced: true 695 } 696 } 697 ,{ 698 type: 'column',//2 699 name: '成交量', 700 data: volumeArray, 701 yAxis: 1, 702 dataGrouping: { 703 enabled: false, 704 forced: true 705 } 706 } ,{ 707 type: 'spline', 708 name: 'MA5', 709 color:'#1aadce', 710 data: MA5Array, 711 lineWidth:1, 712 dataGrouping: { 713 enabled: false, 714 forced: true 715 } 716 },{ 717 type: 'spline', 718 name: 'MA10', 719 data: MA10Array, 720 color:'#8bbc21', 721 threshold: null, 722 lineWidth:1, 723 dataGrouping: { 724 enabled: false, 725 forced: true 726 } 727 },{ 728 type: 'spline', 729 name: 'MA30', 730 data: MA30Array, 731 color:'#910000', 732 threshold: null, 733 lineWidth:1, 734 dataGrouping: { 735 enabled: false, 736 forced: true 737 } 738 } 739 ] 740 }); 741 Highcharts.seriesTypes.column.prototype.drawPoints = originalDrawPoints ; 742 } 743 //ohlcArray和volumeArray中的第i个数据 744 function getTooltipHTML(ohlcArray,volumeArray,i){ 745 //涨跌幅=(今收最新价-昨收)/昨收 746 var time=ohlcArray[i][0]; 747 var zde=0,zdf=0,zs=0; 748 if(i!=0){ 749 zde = parseFloat(ohlcArray[i][4]-ohlcArray[i-1][4]).toFixed(2); 750 zdf = parseFloat((zde/(ohlcArray[i][4])).toFixed(2)); 751 zs=parseFloat(ohlcArray[i-1][4]); //昨天收盘价 752 } 753 var open = ohlcArray[i][1].toFixed(2), 754 high = ohlcArray[i][2].toFixed(2), 755 low = ohlcArray[i][3].toFixed(2), 756 close = ohlcArray[i][4].toFixed(2), 757 y = volumeArray[i][1]; //成交量 758 var tip= '<div><span style="font-size:8px;">'+ Highcharts.dateFormat('%Y-%m-%d %A', this.x) +'</span><br/>'; 759 if(open>zs){ 760 tip += '<span style="font-size:8px;">开盘:</span><span style="font-size:8px;color: #DD2200;align:right;">'+open+' </span><br/>'; 761 }else{ 762 tip += '<span style="font-size:8px;">开盘:</span><span style="font-size:8px;color: #33AA11;align:right;">'+open+' </span><br/>'; 763 } 764 if(high>zs){ 765 tip += '<span style="font-size:8px;">最高:</span></span><span style="font-size:8px;color: #DD2200;align:right;">'+high+' </span><br/>'; 766 }else{ 767 tip += '<span style="font-size:8px;">最高:</span></span><span style="font-size:8px;color: #33AA11;align:right;">'+high+' </span><br/>'; 768 } 769 if(low>zs){ 770 tip += '<span style="font-size:8px;">最低:</span><span style="font-size:8px;color: #DD2200;align:right;">'+low+' </span><br/>'; 771 }else{ 772 tip += '<span style="font-size:8px;">最低:</span><span style="font-size:8px;color: #33AA11;align:right;">'+low+' </span><br/>'; 773 } 774 if(close>zs){ 775 tip += '<span style="font-size:8px;">收盘:</span><span style="font-size:8px;color: #DD2200;align:right;">'+close+' </span><br/>'; 776 }else{ 777 tip += '<span style="font-size:8px;">收盘:</span><span style="font-size:8px;color: #33AA11;align:right;">'+close+' </span><br/>'; 778 } 779 if(zde>0){ 780 tip += '<span style="font-size:8px;">涨跌额:</span><span style="font-size:8px;color: #DD2200;align:right;">'+zde+' </span><br/>'; 781 }else{ 782 tip += '<span style="font-size:8px;">涨跌额:</span><span style="font-size:8px;color: #33AA11;align:right;">'+zde+' </span><br/>'; 783 } 784 if(zdf>0){ 785 tip += '<span style="font-size:8px;">涨跌幅:</span><span style="font-size:8px;color: #DD2200;align:right;">'+zdf+'% </span><br/>'; 786 }else{ 787 tip += '<span style="font-size:8px;">涨跌幅:</span><span style="font-size:8px;color: #33AA11;align:right;">'+zdf+'% </span><br/>'; 788 } 789 if(y>10000){ 790 tip += '<span style="font-size:8px;">成交量 '+(y*0.0001).toFixed(2)+"(亿股)</sapn>"; 791 }else{ 792 tip += '<span style="font-size:8px;">成交量:'+y+"(万股)</span>"; 793 } 794 tip+="</div>" 795 return tip; 796 } 797 function failCallback(){ 798 //常量本地化 799 Highcharts.setOptions({ 800 global : { 801 useUTC : true 802 } 803 }); 804 $(DIVID).highcharts('StockChart', { 805 chart:{ 806 renderTo : DIVID, 807 margin: [0, 0,0, 0], 808 plotBorderColor: '#3C94C4', 809 plotBorderWidth: 0, 810 panning:false, 811 pinchType:'x' 812 }, 813 814 rangeSelector:{ 815 enabled: false, 816 }, 817 /*导出配置*/ 818 exporting: { 819 enabled: false, 820 }, 821 /*创建者信息*/ 822 credits: { 823 enabled: false, 824 }, 825 /*下部时间拖拉选择*/ 826 navigator: { 827 enabled: false, 828 /*关闭时间选择*/ 829 baseseries: 10 830 }, 831 832 scrollbar: { 833 enabled: false /*关闭下方滚动条*/ 834 }, 835 /*底部滚动条*/ 836 scrollbar: { 837 enabled: false 838 }, 839 plotOptions:{ 840 //去掉分时线上的hover事件 841 series: { 842 states: { 843 hover: { 844 enabled: true 845 } 846 }, 847 line: { 848 marker: { 849 enabled: false 850 } 851 }, 852 }, 853 }, 854 yAxis: [{ 855 opposite: false,//是否把它显示到另一边(右边) 856 labels: { 857 align: 'right', 858 x: -3 859 }, 860 title: { 861 text: '' 862 }, 863 height: '60%', 864 lineWidth: 1, 865 }, 866 { 867 opposite: true,//是否把它显示到另一边(右边) 868 labels: { 869 align: 'right', 870 x: 40, 871 }, 872 title: { 873 text: '' 874 }, 875 lineWidth: 1, 876 height: '60%', 877 gridLineWidth: 1, 878 }, 879 { 880 opposite: false,//是否把它显示到另一边(右边) 881 labels: { 882 align: 'right', 883 x: -3, 884 }, 885 title: { 886 text: '' 887 }, 888 top: '65%', 889 height: '35%', 890 offset: 0, 891 lineWidth: 2, 892 }], 893 894 series : [{ 895 name : 'AAPL Stock Price', 896 data : [[0, 15], [10, -50], [20, -56.5], [30, -46.5], [40, -22.1], 897 [50, -2.5], [60, -27.7], [70, -55.7], [80, -76.5]],//[["9:30",200],["10:30",205]["11:30/13:00",210],["14:00",215],["15:00",220]], 898 type : 'scatter', 899 color:'transparent', 900 type : 'areaspline', 901 tooltip : { 902 valueDecimals : 2 903 }, 904 fillColor : { 905 linearGradient : { 906 x1: 0, 907 y1: 0, 908 x2: 0, 909 y2: 1 910 }, 911 stops : [ 912 [0, Highcharts.getOptions().colors[0]], 913 [1, Highcharts.Color(Highcharts.getOptions().colors[0]).setOpacity(0).get('rgba')] 914 ] 915 }, 916 yAxis:0, 917 }, 918 { 919 type: 'column', 920 name: '成交量', 921 data: "", 922 yAxis: 1, 923 dataGrouping: { 924 enabled: false, 925 forced: true 926 }, 927 yAxis:2, 928 }] 929 }); 930 } 931 function getDateUTC(date){ 932 var dArr = new Array(); 933 date+=""; 934 for(var hh=0;hh<3;hh++){ 935 var numb ; 936 if(hh==0){ 937 numb = Number(date.slice(0,4)); 938 } 939 else { 940 numb= Number(date.slice((hh-1)*2+4,hh*2+4)); 941 }; 942 dArr.push(numb); 943 } 944 var dateUTC = Number(Date.UTC(dArr[0],dArr[1],dArr[2],0,0));//得出的UTC时间 945 return dateUTC; 946 }


【推荐】国内首个AI IDE,深度理解中文开发场景,立即下载体验Trae
【推荐】编程新体验,更懂你的AI,立即体验豆包MarsCode编程助手
【推荐】抖音旗下AI助手豆包,你的智能百科全书,全免费不限次数
【推荐】轻量又高性能的 SSH 工具 IShell:AI 加持,快人一步
· 10年+ .NET Coder 心语,封装的思维:从隐藏、稳定开始理解其本质意义
· .NET Core 中如何实现缓存的预热?
· 从 HTTP 原因短语缺失研究 HTTP/2 和 HTTP/3 的设计差异
· AI与.NET技术实操系列:向量存储与相似性搜索在 .NET 中的实现
· 基于Microsoft.Extensions.AI核心库实现RAG应用
· 10年+ .NET Coder 心语 ── 封装的思维:从隐藏、稳定开始理解其本质意义
· 地球OL攻略 —— 某应届生求职总结
· 提示词工程——AI应用必不可少的技术
· Open-Sora 2.0 重磅开源!
· 周边上新:园子的第一款马克杯温暖上架
2014-05-05 c:forEach标签
2014-05-05 网页 内部转发和网址输入不同
2014-05-05 解决刷新使得点击数多次变化问题