pyplot官网教程https://matplotlib.org/users/pyplot_tutorial.html
#导入matplotlib的pyplot模块
import matplotlib.pyplot as plt
plot用于绘制线条
'''
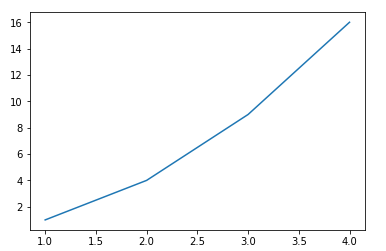
第1步:定义x和y坐标轴上的点
'''
#x坐标轴上点的数值
x=[1, 2, 3, 4]
#y坐标轴上点的数值
y=[1, 4, 9, 16]

'''
第2步:使用plot绘制线条
第1个参数是x的坐标值,第2个参数是y的坐标值
'''
plt.plot(x,y)

'''
第3步:显示图形
'''

plt.show()
设置线条属性,文档:https://matplotlib.org/api/_as_gen/matplotlib.lines.Line2D.html#matplotlib.lines.Line2D
'''
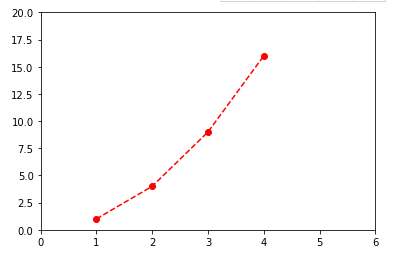
color:线条颜色,值r表示红色(red)
marker:点的形状,值o表示点为圆圈标记(circle marker)
linestyle:线条的形状,值dashed表示用虚线连接各点
'''
plt.plot(x, y, color='r',marker='o',linestyle='dashed')
#plt.plot(x, y, 'ro')
'''
axis:坐标轴范围
语法为axis[xmin, xmax, ymin, ymax],
也就是axis[x轴最小值, x轴最大值, y轴最小值, y轴最大值]
'''
plt.axis([0, 6, 0, 20])
plt.show()
如果matplotlib参入的参数只能是列表的话,这对数据处理很不利。
一般,我们传入的是numpy的数组。实际上,所有参入的值内部都会转换为numpy的数组。
'''
# arange用于生成一个等差数组,arange([start, ]stop, [step, ]
使用见文档:https://docs.scipy.org/doc/numpy/reference/generated/numpy.arange.html
'''
import numpy as np
t = np.arange(0, 5, 0.2)
t
'''
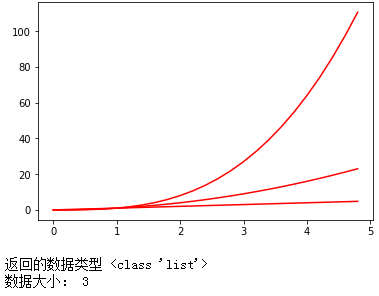
使用数组同时绘制多个线性
'''
#线条1
x1=y1=t

'''
运算符**,表示幂 - 返回x的y次幂,例如10**20表示10的20次方
详细见文档《Python3运算符》:http://www.runoob.com/python3/python3-basic-operators.html
'''
#线条2
x2=x1
y2=t**2

#线条3
x3=x1
y3=t**3

#使用plot绘制线条
linesList=plt.plot(x1, y1,
         x2, y2,
         x3, y3 )

#用setp方法可以同时设置多个线条的属性
plt.setp(linesList, color='r')

plt.show()

print('返回的数据类型',type(linesList))
print('数据大小:',len(linesList))
在图上添加文本
#找到 matplotlib 加载的配置文件路径
import matplotlib
matplotlib.matplotlib_fname()
"""设置字体,用于显示中文"""
plt.rcParams['font.sans-serif']=['FangSong']
"""SimSun 宋体,Microsoft YaHei微软雅黑 YouYuan幼圆 FangSong仿宋"""
plt.rcParams['font.size']=20
plt.rcParams['axes.unicode_minus']=False# 负号乱码
'''
第1步:定义x和y坐标轴上的点
'''
#x坐标轴上点的数值
x=[1, 2, 3, 4]
#y坐标轴上点的数值
y=[1, 4, 9, 16]

'''
第2步:使用plot绘制线条
第1个参数是x的坐标值,第2个参数是y的坐标值
'''
plt.plot(x,y)

'''
添加文本
'''
#x轴文本
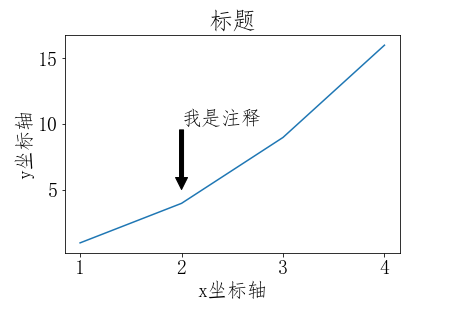
plt.xlabel('x坐标轴')
#y轴文本
plt.ylabel('y坐标轴')
#标题
plt.title('标题')
#添加注释
'''
添加注释:
参数名xy:箭头注释中箭头所在位置,
参数名xytext:注释文本所在位置,
arrowprops在xy和xytext之间绘制箭头,
shrink表示注释点与注释文本之间的图标距离
'''
plt.annotate('我是注释', xy=(2,5), xytext=(2, 10),
            arrowprops=dict(facecolor='black', shrink=0.01),
            )
'''
第3步:显示图形
'''
plt.show()
多个图绘图
#创建画板1
fig = plt.figure(1)

#第2步:创建画纸(子图)
'''
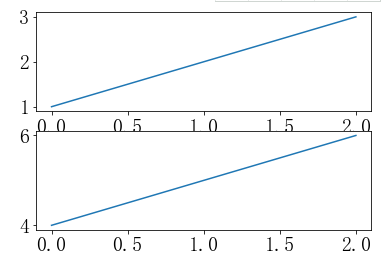
subplot()方法里面传入的三个数字
前两个数字代表要生成几行几列的子图矩阵,第三个数字代表选中的子图位置
subplot(211)生成一个2行1列的子图矩阵,当前是第一个子图
'''
#创建画纸,并选择画纸1
#等价于ax1=fig.add_subplot(211)
ax1=plt.subplot(2,1,1)
#在画纸上绘图
plt.plot([1, 2, 3])
#选择画纸2
ax2=plt.subplot(2,1,2)
#在画纸2上绘图
plt.plot([4, 5, 6])

plt.show()
如果没有指明画板figure()和子图subplot,会默认创建一个画板figure(1) 和一个子图subplot(111)
悟已往之不谏,知来者之可追。

