
vue echarts 从后台获取数据形成饼图,柱状图,折线图
一、vue代码
<template>
  <div class="main">
   <div v-for="(item,index) in itemCategory" :key="index" :class="[index%2 === 0 ? 'wupina':' wupinb']">
              <div v-if="index%2 != 0" class="wupinphoto">
                <img width="50" height="50" :src="getImgUrl(item,index)" alt="">
              </div>
              <div class="wupintext001">{{ item.itemTypeName }}</div>
              <div class="wupintext002">{{ item.itemNum }}件</div>
              <div v-if="index%2 === 0" class="wupinphoto">
                <img width="50" height="50" :src="getImgUrl(item,index)" alt="">
              </div>
            </div>
 <div class="zhixing003"> <div id="task_bar" style="width:600px;height:250px;" /></div>
 <div class="titlebg2"><div id="item_line" class="qushi" /></div>
 <div id="duration_pie" :style="{height:height,width:width}" />
 </div>
</template>
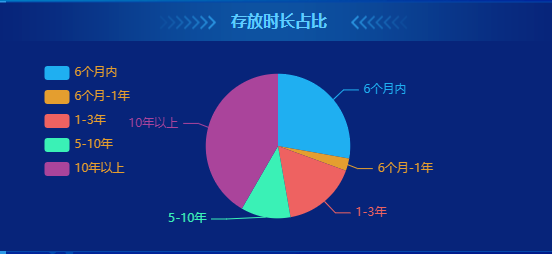
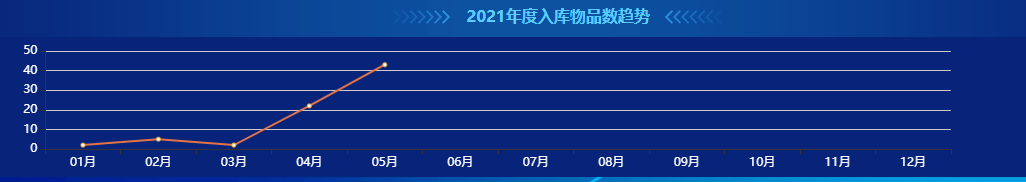
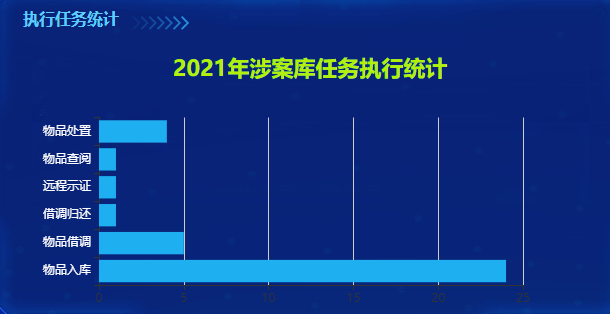
<script>
/* eslint-disable */
import Config from '@/settings'
import {getInitInfo} from '@/api/show'
import echarts from 'echarts'
export default {
  name: "show",
    props: {
    className: {
      type: String,
      default: 'chart'
    },
    width: {
      type: String,
      default: '100%'
    },
    height: {
      type: String,
      default: '170px'
    }
  },
  data() {
    return {
      chart: null,
      involvedItemNUmbers: "",
      customersNumbers:"",
      nationalEmblemFirst: Config.nationalEmblemFirst,
      nationalEmblemSecond: Config.nationalEmblemSecond,
      nationalEmblemThird: Config.nationalEmblemThird,
      nationalEmblemForth: Config.nationalEmblemForth,
      nationalEmblemFifth: Config.nationalEmblemFifth,
      area: Config.area,
      person: Config.person,
      capital: Config.capital,
      vehicle: Config.vehicle,
      monitoringEquipment: Config.monitoringEquipment,
      auxiliaryEquipment: Config.auxiliaryEquipment,
      videoFirst: Config.videoFirst,
      videoSecond: Config.videoSecond,
      videoThird: Config.videoThird,
      videoForth: Config.videoForth,
      durationList:[],
      itemCategory:[],
      messageList:[],
      itemList:[],
      taskList:[],
      color: '#000',
    };
  },
  mounted(){
    // 界面数据从后台获取
    this.init();
  },
  methods: {
    // 调用后台获取数据
    init(){
      getInitInfo().then(res =>{
        if(res.code == 200){
            let result =JSON.parse(res.result);
            // 物品总数
            this.involvedItemNUmbers =result.itemTotal;
            // 服务客户总数
            this.customersNumbers = result.customers;
            // 存放时长
            this.durationList= result.durationList;
            let data = []
            if(this.durationList !=null && this.durationList.length >0){
              for(let i = 0; i < this.durationList.length; i++){
                let a = { value: this.durationList[i].itemAmount, name: this.durationList[i].durationName }
                data.push(a)
              }
              // 展示饼图数据
              this.initChart(data);
            }
            // 物品类别
            this.itemCategory= result.itemCategory;
            // 实时预警
            this.messageList= result.mesList;
            // 任务列表
            this.taskList= result.taskList;
            if(this.taskList !=null && this.taskList.length >0){
              // 任务类型
              let arrY=[];
              // 具体数值
              let arrX=[];
              for(let i = 0; i < this.taskList.length; i++){
                // Y轴显示类型
                arrY.push(this.taskList[i].taskTypeName);
                // 具体类型数据
                arrX.push(this.taskList[i].itemCount);
              }
              // 展示柱状图
              this.initBarChart(arrX,arrY);
            }
            // 年度入库物品数
            this.itemList = result.itemList;
            if(this.itemList !=null && this.itemList.length >0){
                // 任务类型
                let number=[];
                for(let i = 0; i < this.itemList.length; i++){
                  // 每个月的物品数据
                  number.push(this.itemList[i].itemNum);
                }
                // 展示折线图
                this.initLineChart(number);
            }
        }else{
           this.$publicjs.showMessage(res.message, this.$publicjs.ErrorType);
        }
      }).catch(e =>{
         this.$publicjs.showMessage(e, this.$publicjs.ErrorType);
      })
    },
    getImgUrl(item,index){
      if(item.itemTypeName == "贵重物品"){
        return require("@/assets/show_images/wupin002.png");
      } else if(item.itemTypeName == "普通物品"){
        return require("@/assets/show_images/wupin003.png");
      }else if(item.itemTypeName == "电子设备"){
        return require("@/assets/show_images/wupin001.png");
      }else if(item.itemTypeName == "低温冷藏物品"){
        return require("@/assets/show_images/wupin005.png");
      }else if(item.itemTypeName == "危险品"){
        return require("@/assets/show_images/wupin004.png");
      }else{
         return require("@/assets/show_images/wupin001.png");
      }

    },
    // 存放时长饼图初始化
    initChart(data) {
      this.chart = echarts.init(document.getElementById('duration_pie'));
      this.chart.setOption({
        tooltip: {
          trigger: 'item',
          formatter: '{a} <br/>{b} ({d}%)',
        },
        // 全局调色盘。
        color: ['#1FAFF1','#E49E2F','#EE6261', '#3AF1B6', '#AA449B'],
        legend: {
          orient: 'vertical',
          left: '5%',
          textStyle: {
            // 图例文字颜色
            color: '#E49E2F'
          }
        },
        series: [
          {
            name: '存放时长',
            type: 'pie',
            radius: '85%',
            data: data
          }
        ]
      })
    },
    // 执行任务柱状图展示
    initBarChart(arrX,arrY) {
      this.chart = echarts.init(document.getElementById('task_bar'));
      this.chart.setOption({
          tooltip: {
              trigger: 'axis',
              axisPointer: {
                  type: 'shadow'
              }
          },
          // 全局调色盘。
          color: ['#1EAFF1'],
          grid: {
              left: '10%',
              top:'15%',
              bottom:'10%',
              containLabel: true
          },
          xAxis: {
              type: 'value',
              boundaryGap: [0, 0.01],
              axisLabel: {
                  show: true,
              }
          },
          yAxis: {
              type: 'category',
              data: arrY,
              axisLabel: {
                  show: true,
                  textStyle: {
                      color: '#fff'
                  },
              }
          },
          series: [
              {
                  name: '2021年',
                  type: 'bar',
                  data: arrX
              }
          ]
      })
    },
    // 年度入库物品数
    initLineChart(arrY){
      this.chart = echarts.init(document.getElementById('item_line'));
      this.chart.setOption({
        tooltip: {
          trigger: 'axis',
        },
        xAxis: {
          type: 'category',
          axisLabel: {
            show: true,
            textStyle: {
                color: '#fff'
            },
          },
          data: ['01月', '02月', '03月', '04月', '05月', '06月', '07月','08月','09月','10月','11月','12月']
        },
        yAxis: {
          type: 'value',
          axisLabel: {
            show: true,
            textStyle: {
                color: '#fff'
            }
          },
        },
        grid: {
          top:'10%',
          bottom:'20%'
        },
        series: [{
            data: arrY,
            type: 'line',
            itemStyle : {
              normal : {
                color:'#E49E2F', //改变折线点的颜色
                lineStyle:{
                  color:'#E37246' //改变折线颜色
                }
              }
            },
        }],

      })
    }
  }
};
</script>
二 最终样式 echarts相关例子(https://echarts.apache.org/examples/zh/index.html)
问题一:echarts中出现tooltip时页面相对定位布局出现抖动
1、分析原因:
在echarts图表中出现tooltip时,画布的父标签(即:echarts.init()的标签)的有时宽高都会发生变化,导致相对布局的div可能大小发生变化(画布大小却不变),导致页面闪动。
2、解决办法:
在该画布的父标签(即:echarts.init()的标签)外层套一个div,设置overflow:hidden;然后,设置tooltip的confine:true;(设置tooltip不超出图表)。

 浙公网安备 33010602011771号