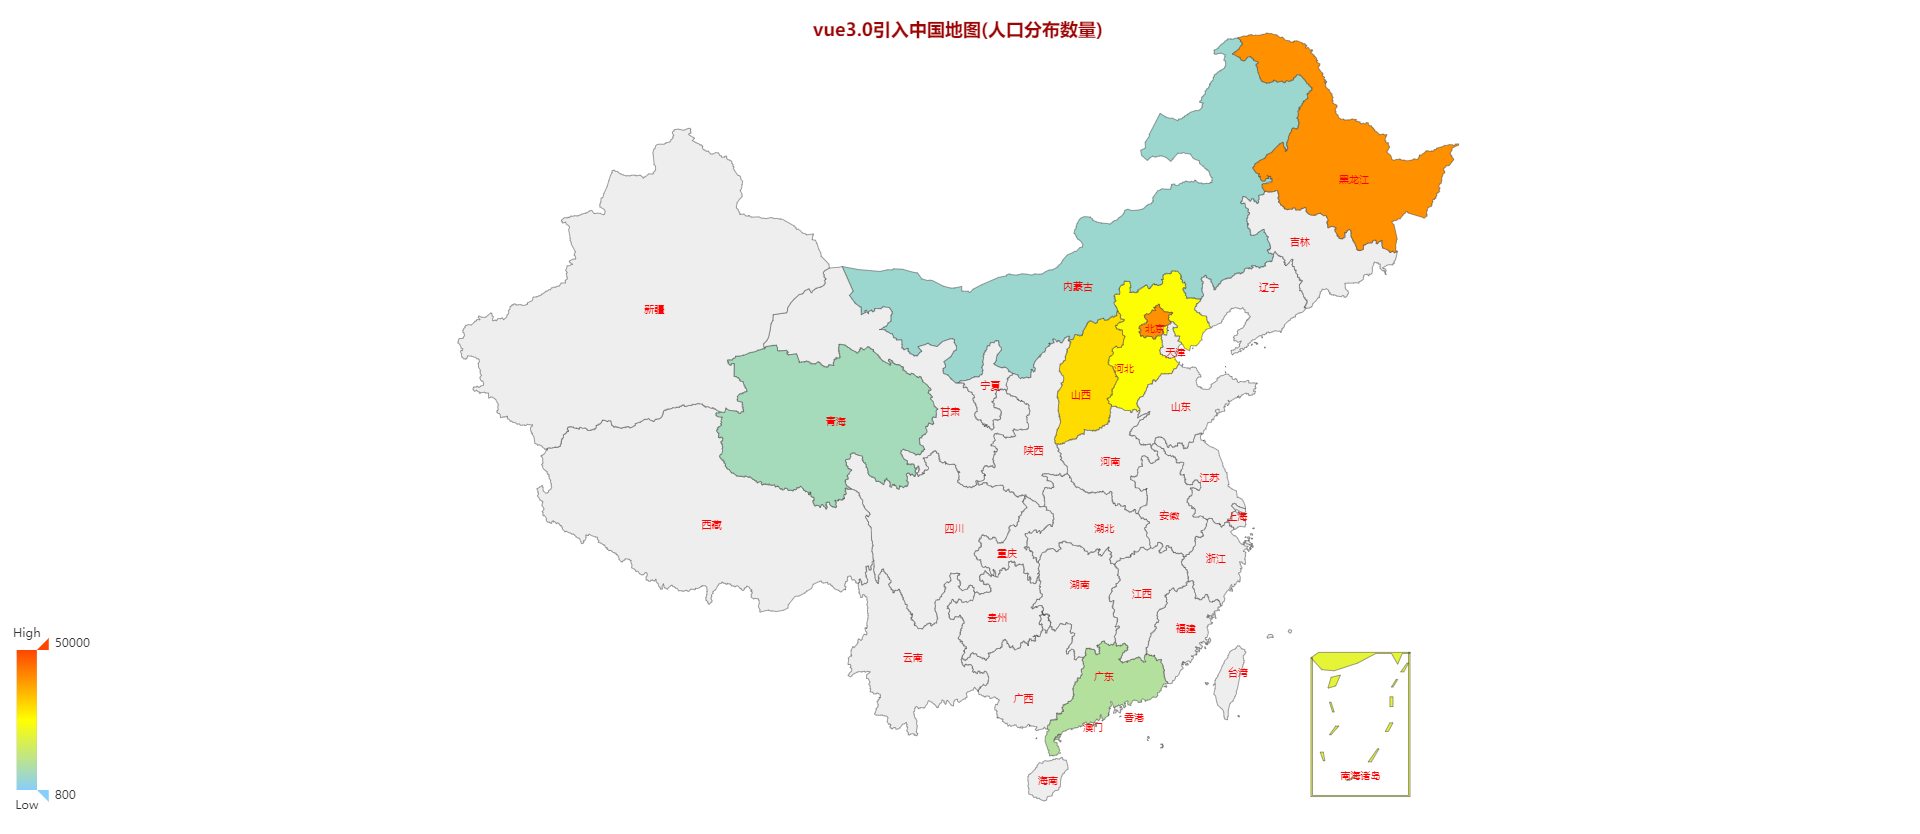
Vue3.0 + Echarts 实现地区人口数量分布展示
需求:
按照人口数量密集度,颜色由浅到深展示
实现:
基于现有的Vue3.0+4.5.13Cli框架,安装Echarts
npm install echarts@4.9.0 --save
安装成功后,就可以直接使用了
<template>
  <div class="about">
    <div ref="chart" style="width: 1900px;height:800px;"></div>
  </div>
</template>
<script>
// 导入图表
import echarts from 'echarts'
// 导入中国地图
import 'echarts/map/js/china'
import { reactive,ref,onMounted } from 'vue'
export default {
  // 启动函数
  setup(){
    const state = reactive({
      chart:ref()
    })

    const init = () => {
      if(state.chart){
        // 图表的初始化
        let mycat = echarts.init(state.chart)
        const option = {
          title:{
            text:'vue3.0引入中国地图(人口分布数量)',
            x:'center',
            textStyle: {
              color:'#9c0505'
            }
          },
          // 数据和类型
          series: [{
            type:'map',
            map:'china',
            label:{
              show: true,
              color:'red',
              fontSize:10
            },
            // 地图大小倍数
            zoom:1.2,
            data:[
              {name:'北京',value:40000},
              {name:'山西',value:30000},
              {name:'内蒙古',value:5000},
              {name:'青海',value:7000},
              {name:'河北',value:25000},
              {name:'广东',value:10000},
              {name:'黑龙江',value:40000},
              {name:'南海诸岛',value:20000},
            ]
          }],
          visualMap:{
            min: 800,
            max: 50000,
            text: ['High', 'Low'],
            realtime: false,
            calculable: true,
            inRange: {
              color: ['lightskyblue', 'yellow', 'orangered']
            }
          }
        }
        // 指定数据项和数据显示
        mycat.setOption(option);
      }
    }

    onMounted(() => {
      init();
    })

    return state
  }
}
</script>
效果

最后将代码封装成组件,在展示时传入数据调用即可
作者:彼岸舞
时间:2021\06\29
内容关于:VUE
本文属于作者原创,未经允许,禁止转发
分类:
VUE


【推荐】国内首个AI IDE,深度理解中文开发场景,立即下载体验Trae
【推荐】编程新体验,更懂你的AI,立即体验豆包MarsCode编程助手
【推荐】抖音旗下AI助手豆包,你的智能百科全书,全免费不限次数
【推荐】轻量又高性能的 SSH 工具 IShell:AI 加持,快人一步
· 从 HTTP 原因短语缺失研究 HTTP/2 和 HTTP/3 的设计差异
· AI与.NET技术实操系列:向量存储与相似性搜索在 .NET 中的实现
· 基于Microsoft.Extensions.AI核心库实现RAG应用
· Linux系列:如何用heaptrack跟踪.NET程序的非托管内存泄露
· 开发者必知的日志记录最佳实践
· winform 绘制太阳,地球,月球 运作规律
· AI与.NET技术实操系列(五):向量存储与相似性搜索在 .NET 中的实现
· 超详细:普通电脑也行Windows部署deepseek R1训练数据并当服务器共享给他人
· 上周热点回顾(3.3-3.9)
· AI 智能体引爆开源社区「GitHub 热点速览」