
(一)如何用ChartDirector绘制滚动图表
ChartDirector是一个非常容易上手的Web图表控件,参照它的JSP例子,简单修改一下就可以创建一系列基于Web的图表。下面跟大家分享用ChartDirector(C++)绘制的可滚动和缩放的图表。下面为大家奉上了源代码,首先解释一下代码的组成部分:
- 初始化:将数据加载到内存,然后初始化CChartViewer;
- CVN_ViewPortChanged消息处理器:用于更新图表和图像映射;
- drawChart:这是创建图表的核心部分。首先用ViewPortManager.getValueAtViewPort获取可见数据范围,然后获取 数据范围中的值。最后用ViewPortManager.syncDateAxisWithViewPort将X轴配置与视图端口同步。
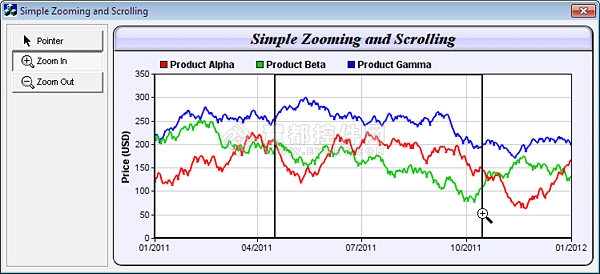
下面是绘制一个可滚动和缩放图表的主要源代码,完整代码请参考ChartDirector MFC项目中的"mfcdemo/simplezoomscroll"
[File: mfcdemo/simplezoomscroll/simplezoomscrollDlg.cpp]
|
1
2
3
4
5
6
7
8
9
10
11
12
13
14
15
16
17
18
19
20
21
22
23
24
25
26
27
28
29
30
31
32
33
34
35
36
37
38
39
40
41
42
43
44
45
46
47
48
49
50
51
52
53
54
55
56
57
58
59
60
61
62
63
64
65
66
67
68
69
70
71
72
73
74
75
76
77
78
79
80
81
82
83
84
85
86
87
88
89
90
91
92
93
94
95
96
97
98
99
100
101
102
103
104
105
106
107
108
109
110
111
112
113
114
115
116
117
118
119
120
121
122
123
124
125
126
127
128
129
130
131
132
133
134
135
136
137
138
139
140
141
142
143
144
145
146
147
148
149
150
151
152
153
154
155
156
157
158
159
160
161
162
163
164
165
166
167
168
169
170
171
172
173
174
175
176
177
178
179
180
181
182
183
184
185
186
187
188
189
190
191
192
193
194
195
196
197
198
199
200
201
202
203
204
205
206
207
208
209
210
211
212
213
214
215
216
217
218
219
220
221
222
223
224
225
226
227
228
229
230
231
232
233
234
235
236
237
238
239
240
241
242
243
244
245
246
247
248
249
250
251
252
253
254
255
256
257
258
259
260
261
262
263
264
265
266
267
268
269
270
271
272
273
274
275
276
277
278
279
280
281
282
283
284
285
286
287
288
289
290
291
292
293
294
295
296
297
298
299
300
301
302
303
304
305
306
307
308
309
310
311
312
313
314
315
316
317
318
319
320
321
322
323
324
325
326
327
328
329
330
331
332
333
334
335
336
337
338
339
340
341
|
// simplezoomscrollDlg.cpp : implementation file//#include "stdafx.h"#include "simplezoomscroll.h"#include "simplezoomscrollDlg.h"#include "chartdir.h"#include <math.h>#ifdef _DEBUG#define new DEBUG_NEW#endif/////////////////////////////////////////////////////////////////////////////// CSimplezoomscrollDlg dialog//// Constructor//CSimplezoomscrollDlg::CSimplezoomscrollDlg(CWnd* pParent /*=NULL*/) : CDialog(CSimplezoomscrollDlg::IDD, pParent){ m_hIcon = AfxGetApp()->LoadIcon(IDR_MAINFRAME);}//// Destructor//CSimplezoomscrollDlg::~CSimplezoomscrollDlg(){ delete m_ranSeries; delete m_ChartViewer.getChart();}void CSimplezoomscrollDlg::DoDataExchange(CDataExchange* pDX){ CDialog::DoDataExchange(pDX); //{{AFX_DATA_MAP(CSimplezoomscrollDlg) DDX_Control(pDX, IDC_PointerPB, m_PointerPB); DDX_Control(pDX, IDC_ChartViewer, m_ChartViewer); //}}AFX_DATA_MAP}BEGIN_MESSAGE_MAP(CSimplezoomscrollDlg, CDialog) //{{AFX_MSG_MAP(CSimplezoomscrollDlg) ON_WM_PAINT() ON_WM_QUERYDRAGICON() ON_WM_DESTROY() ON_BN_CLICKED(IDC_PointerPB, OnPointerPB) ON_BN_CLICKED(IDC_ZoomInPB, OnZoomInPB) ON_BN_CLICKED(IDC_ZoomOutPB, OnZoomOutPB) ON_CONTROL(CVN_ViewPortChanged, IDC_ChartViewer, OnViewPortChanged) //}}AFX_MSG_MAPEND_MESSAGE_MAP()/////////////////////////////////////////////////////////////////////////////// CSimplezoomscrollDlg message handlers//// Initialization//BOOL CSimplezoomscrollDlg::OnInitDialog(){ CDialog::OnInitDialog(); // *** code automatically generated by VC++ MFC AppWizard *** // Set the icon for this dialog. The framework does this automatically // when the application's main window is not a dialog SetIcon(m_hIcon, TRUE); // Set big icon SetIcon(m_hIcon, FALSE); // Set small icon // Load icons to mouse usage buttons loadButtonIcon(IDC_PointerPB, IDI_PointerPB, 100, 20); loadButtonIcon(IDC_ZoomInPB, IDI_ZoomInPB, 100, 20); loadButtonIcon(IDC_ZoomOutPB, IDI_ZoomOutPB, 100, 20); // // Initialize member variables // m_extBgColor = getDefaultBgColor(); // Default background color // Load the data loadData(); // Initialize the CChartViewer initChartViewer(&m_ChartViewer); // Trigger the ViewPortChanged event to draw the chart m_ChartViewer.updateViewPort(true, true); return TRUE;}// *** code automatically generated by VC++ MFC AppWizard ***// If you add a minimize button to your dialog, you will need the code below// to draw the icon. For MFC applications using the document/view model,// this is automatically done for you by the framework.void CSimplezoomscrollDlg::OnPaint() { if (IsIconic()) { CPaintDC dc(this); // device context for painting SendMessage(WM_ICONERASEBKGND, (WPARAM) dc.GetSafeHdc(), 0); // Center icon in client rectangle int cxIcon = GetSystemMetrics(SM_CXICON); int cyIcon = GetSystemMetrics(SM_CYICON); CRect rect; GetClientRect(&rect); int x = (rect.Width() - cxIcon + 1) / 2; int y = (rect.Height() - cyIcon + 1) / 2; // Draw the icon dc.DrawIcon(x, y, m_hIcon); } else { CDialog::OnPaint(); }}// *** code automatically generated by VC++ MFC AppWizard ***// The system calls this to obtain the cursor to display while the user drags// the minimized window.HCURSOR CSimplezoomscrollDlg::OnQueryDragIcon(){ return (HCURSOR) m_hIcon;}//// User clicks on the Pointer pushbutton//void CSimplezoomscrollDlg::OnPointerPB() { m_ChartViewer.setMouseUsage(Chart::MouseUsageScroll); }//// User clicks on the Zoom In pushbutton//void CSimplezoomscrollDlg::OnZoomInPB() { m_ChartViewer.setMouseUsage(Chart::MouseUsageZoomIn); }//// User clicks on the Zoom Out pushbutton//void CSimplezoomscrollDlg::OnZoomOutPB() { m_ChartViewer.setMouseUsage(Chart::MouseUsageZoomOut); }//// The ViewPortChanged event handler. This event occurs if the user scrolls or zooms in or // out the chart by dragging or clicking on the chart. It can also be triggered by calling// CChartViewer.updateViewPort.//void CSimplezoomscrollDlg::OnViewPortChanged(){ if (m_ChartViewer.needUpdateChart()) drawChart(&m_ChartViewer); if (m_ChartViewer.needUpdateImageMap()) updateImageMap(&m_ChartViewer);}/////////////////////////////////////////////////////////////////////////////// CSimplezoomscrollDlg methods//// Load the data//void CSimplezoomscrollDlg::loadData(){ // In this example, we just use random numbers as data. m_ranSeries = new RanSeries(127); m_timeStamps = m_ranSeries->getDateSeries(1827, Chart::chartTime(2007, 1, 1), 86400); m_dataSeriesA = m_ranSeries->getSeries(1827, 150, -10, 10); m_dataSeriesB = m_ranSeries->getSeries(1827, 200, -10, 10); m_dataSeriesC = m_ranSeries->getSeries(1827, 250, -8, 8);}//// Initialize the CChartViewer //void CSimplezoomscrollDlg::initChartViewer(CChartViewer *viewer){ // Set the full x range to be the duration of the data viewer->setFullRange("x", m_timeStamps[0], m_timeStamps[m_timeStamps.len - 1]); // Initialize the view port to show the latest 20% of the time range viewer->setViewPortWidth(0.2); viewer->setViewPortLeft(1 - viewer->getViewPortWidth()); // Set the maximum zoom to 10 points viewer->setZoomInWidthLimit(10.0 / m_timeStamps.len); // Initially set the mouse to drag to scroll mode. m_PointerPB.SetCheck(1); viewer->setMouseUsage(Chart::MouseUsageScroll);}//// Draw the chart and display it in the given viewer//void CSimplezoomscrollDlg::drawChart(CChartViewer *viewer){ // Get the start date and end date that are visible on the chart. double viewPortStartDate = viewer->getValueAtViewPort("x", viewer->getViewPortLeft()); double viewPortEndDate = viewer->getValueAtViewPort("x", viewer->getViewPortLeft() + viewer->getViewPortWidth()); // Get the array indexes that corresponds to the visible start and end dates int startIndex = (int)floor(Chart::bSearch(m_timeStamps, viewPortStartDate)); int endIndex = (int)ceil(Chart::bSearch(m_timeStamps, viewPortEndDate)); int noOfPoints = endIndex - startIndex + 1; // Extract the part of the data array that are visible. DoubleArray viewPortTimeStamps = DoubleArray(m_timeStamps.data + startIndex, noOfPoints); DoubleArray viewPortDataSeriesA = DoubleArray(m_dataSeriesA.data + startIndex, noOfPoints); DoubleArray viewPortDataSeriesB = DoubleArray(m_dataSeriesB.data + startIndex, noOfPoints); DoubleArray viewPortDataSeriesC = DoubleArray(m_dataSeriesC.data + startIndex, noOfPoints); // // At this stage, we have extracted the visible data. We can use those data to plot the chart. // /////////////////////////////////////////////////////////////////////////////////////// // Configure overall chart appearance. /////////////////////////////////////////////////////////////////////////////////////// // Create an XYChart object 600 x 300 pixels in size, with pale blue (0xf0f0ff) background, // black (000000) rounded border, 1 pixel raised effect. XYChart *c = new XYChart(600, 300, 0xf0f0ff, 0, 1); c->setRoundedFrame(m_extBgColor); // Set the plotarea at (52, 60) and of size 520 x 205 pixels. Use white (ffffff) background. // Enable both horizontal and vertical grids by setting their colors to grey (cccccc). Set // clipping mode to clip the data lines to the plot area. c->setPlotArea(52, 60, 520, 205, 0xffffff, -1, -1, 0xcccccc, 0xcccccc); // As the data can lie outside the plotarea in a zoomed chart, we need to enable clipping. c->setClipping(); // Add a top title to the chart using 15 pts Times New Roman Bold Italic font, with a light blue // (ccccff) background, black (000000) border, and a glass like raised effect. c->addTitle("Simple Zooming and Scrolling", "timesbi.ttf", 15 )->setBackground(0xccccff, 0x0, Chart::glassEffect()); // Add a legend box at the top of the plot area with 9pts Arial Bold font with flow layout. c->addLegend(50, 33, false, "arialbd.ttf", 9)->setBackground(Chart::Transparent, Chart::Transparent); // Set axes width to 2 pixels c->yAxis()->setWidth(2); c->xAxis()->setWidth(2); // Add a title to the y-axis c->yAxis()->setTitle("Price (USD)", "arialbd.ttf", 9); /////////////////////////////////////////////////////////////////////////////////////// // Add data to chart /////////////////////////////////////////////////////////////////////////////////////// // // In this example, we represent the data by lines. You may modify the code below to use other // representations (areas, scatter plot, etc). // // Add a line layer for the lines, using a line width of 2 pixels LineLayer *layer = c->addLineLayer(); layer->setLineWidth(2); // In this demo, we do not have too many data points. In real code, the chart may contain a lot // of data points when fully zoomed out - much more than the number of horizontal pixels in this // plot area. So it is a good idea to use fast line mode. layer->setFastLineMode(); // Now we add the 3 data series to a line layer, using the color red (ff0000), green // (00cc00) and blue (0000ff) layer->setXData(viewPortTimeStamps); layer->addDataSet(viewPortDataSeriesA, 0xff0000, "Product Alpha"); layer->addDataSet(viewPortDataSeriesB, 0x00cc00, "Product Beta"); layer->addDataSet(viewPortDataSeriesC, 0x0000ff, "Product Gamma"); /////////////////////////////////////////////////////////////////////////////////////// // Configure axis scale and labelling /////////////////////////////////////////////////////////////////////////////////////// // Set the x-axis as a date/time axis with the scale according to the view port x range. viewer->syncDateAxisWithViewPort("x", c->xAxis()); // In this demo, we rely on ChartDirector to auto-label the axis. We ask ChartDirector to ensure // the x-axis labels are at least 75 pixels apart to avoid too many labels. c->xAxis()->setTickDensity(75); /////////////////////////////////////////////////////////////////////////////////////// // Output the chart /////////////////////////////////////////////////////////////////////////////////////// delete viewer->getChart(); viewer->setChart(c);}//// Update the image map//void CSimplezoomscrollDlg::updateImageMap(CChartViewer *viewer){ // Include tool tip for the chart if (0 == viewer->getImageMapHandler()) { viewer->setImageMap(viewer->getChart()->getHTMLImageMap("", "", "title='[{dataSetName}] {x|mmm dd, yyyy}: USD {value|2}'")); }}/////////////////////////////////////////////////////////////////////////////// General utilities//// Get the default background color//int CSimplezoomscrollDlg::getDefaultBgColor(){ LOGBRUSH LogBrush; HBRUSH hBrush = (HBRUSH)SendMessage(WM_CTLCOLORDLG, (WPARAM)CClientDC(this).m_hDC, (LPARAM)m_hWnd); ::GetObject(hBrush, sizeof(LOGBRUSH), &LogBrush); int ret = LogBrush.lbColor; return ((ret & 0xff) << 16) | (ret & 0xff00) | ((ret & 0xff0000) >> 16);}//// Load an icon resource into a button//void CSimplezoomscrollDlg::loadButtonIcon(int buttonId, int iconId, int width, int height){ GetDlgItem(buttonId)->SendMessage(BM_SETIMAGE, IMAGE_ICON, (LPARAM)::LoadImage( AfxGetResourceHandle(), MAKEINTRESOURCE(iconId), IMAGE_ICON, width, height, LR_DEFAULTCOLOR)); } |
欢迎加群交流控件经验:301644590

