echarts记录篇(一):使用柱状图实现排名前边有排序数字
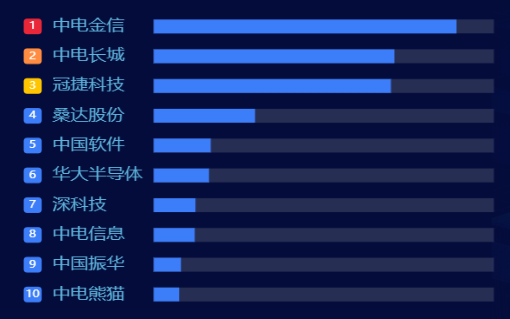
一、效果如图:
二、直接上代码
yAxis: {
      inverse: true, //如果数据数组倒置排序,加上此代码
      data: categories1,
      offset: 0,
      axisLabel: {
        fontSize: 18,
        color: "#5DB3DC",
        margin: 130, // 距离右侧图形距离,配合axisLabel.left 和 grid.left 使用
        align: "left",
        rich: {
          a1: {
            color: "#fff",
            backgroundColor: "#EA2739",
            width: 18,
            height: 18,
            align: "center",
            borderRadius: 4,
          },
          a2: {
            color: "#fff",
            backgroundColor: "#FF8C40",
            width: 18,
            height: 18,
            align: "center",
            borderRadius: 4,
          },
          a3: {
            color: "#fff",
            backgroundColor: "#FFC600",
            width: 18,
            height: 18,
            align: "center",
            borderRadius: 4,
          },
          a4: {
            color: "#fff",
            backgroundColor: "#3C7DF9",
            width: 18,
            height: 18,
            align: "center",
            borderRadius: 4,
          },
        },
        formatter: (params, index) => {
          console.log(params, "啦啦哈");
          // ${" ".repeat(5)} 是添加5个空格
          let result;
          if (index == 0) {
            result = `{a1|${index + 1}}${" ".repeat(2)}${params}`;
          } else if (index == 1) {
            result = `{a2|${index + 1}}${" ".repeat(2)}${params}`;
          } else if (index == 2) {
            result = `{a3|${index + 1}}${" ".repeat(2)}${params}`;
          } else {
            result = `{a4|${index + 1}}${" ".repeat(2)}${params}`;
          }
          return result;
        },
      },
      axisLine: {
        show: false,
      },
      axisTick: {
        show: false,
      },
      splitLine: {
        //修改背景线条样式
        show: false,
      },
    },
主要通过formatter和rich配合而成;在配置yAxis<axisLabel中写下此代码。
是我吖~

 浙公网安备 33010602011771号