搬家第五天-124.Wincc V7.3 MSChart控件初步使用3-曲线上标记点写上数字
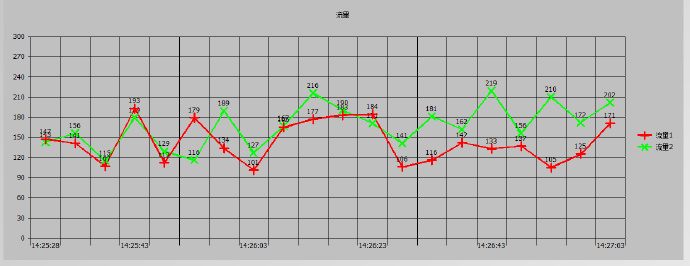
前面的博客介绍了怎么让MSChart显示一条/多条曲线,曲线上点的数值只有肉眼对比纵坐标轴,不是很方便。本文介绍如何在曲线上显示标记点的数值。
假设画面上有ListView控件作为曲线数据源,名字为LV,已经有了数据,有一个MSChart控件,用于显示曲线,名字修改为Chart,在按钮的鼠标点击事件中添加以下vbs脚本:
Sub OnClick(ByVal Item)
Dim LV,Chart,flow1(),flow2(),mytime(),RowCount,i
Set LV=ScreenItems("LV")
Set Chart=ScreenItems("Chart")
RowCount=LV.listitems.count
Redim flow1(RowCount),flow2(RowCount),MyTime(RowCount)
For i=1 To RowCount
flow1(i)=CInt(LV.listItems.item(i).listsubitems.item(4).text)
flow2(i)=CInt(LV.listItems.item(i).listsubitems.item(5).text)
MyTime(i)=CStr(LV.listItems.item(i).listsubitems.item(3).text)
Next
'初始化chart控件
'.Axis坐标轴有两个参数,第一个axisId指坐标轴编号;第二个参数为保留参数,此处为1,可以不写
'坐标轴编号0,1,2,3,4
'0为x轴,1为y轴,2位第二y轴,3为z轴,4表示无坐标轴
With Chart
.TitleText = "流量"
.ColumnCount=2 '两条曲线
' '设置图线的外观
' '设置XY轴
.Plot.Axis(0).ValueScale.Auto = 0
.Plot.Axis(1).ValueScale.Auto = 0
'// '设置最大值
.Plot.Axis(0).ValueScale.Maximum = RowCount '设置横轴标注最大值
.Plot.Axis(1).ValueScale.Maximum = 300 '设置纵轴标注最大值
'// '设置最小值
.Plot.Axis(0).ValueScale.Minimum = 0
.Plot.Axis(1).ValueScale.Minimum = 0
.RowCount =RowCount
.Plot.Axis(0).AxisGrid.MajorPen.Style = 1
.Plot.Axis(1).AxisGrid.MajorPen.Style = 1
.Plot.AutoLayout = 1
.Plot.UniformAxis = 0
'图表类型
.chartType = 3
'横坐标轴标注
For i = 1 To RowCount
.Row = i
.RowLabel = "" '先清空标签
Next
.Row=1
.RowLabel=CStr(MyTime(1))
For i=1 To 5
.Row = i*4
.RowLabel = CStr(MyTime(i*4))
Next
'设置曲线1
.ShowLegend = 1 '显示图例
.Column=1
.ColumnLabel = "流量1"
.RandomFill=False
For i=1 To RowCount
.row = i
.data=flow1(i)
Next
With .Plot.SeriesCollection(1).DataPoints(-1)
.DataPointLabel.LocationType = 1 ''&& 为1时显示数值,0为不显示
'将数据点标记设置成可见的。
.Marker.Visible = True
.Marker.Style = 2
End With
'设置曲线2
.Column=2
.ColumnLabel = "流量2"
.RandomFill=False
For i=1 To RowCount
.row = i
.data=flow2(i)
Next
With .Plot.SeriesCollection(2).DataPoints(-1)
.DataPointLabel.LocationType = 1 ''&& 为1时显示数值,0为不显示
'将数据点标记设置成可见的。
.Marker.Visible = True
.Marker.Style = 2
End With
End With
End Sub
加粗的字体就是用于显示标记点数字的。保存运行后是这个效果:


