6.2. pyplot作图
1.折线图和散点图
    t = np.arange(0,4,0.1)
    plt.plot(t,t,'o',t,t+2,t,t**2,'o')
    plt.show()
2.柱线图
plt.bar(x,y)
6.3. pylab作图
同理
    t = np.arange(0,4,0.1)
    pl.plot(t,t+2)
    pl.show()
6.4.pandas作图
显示股票数据,kind=bar,pie,
    t = ts.get_hist_data('002909')
    # 标题和参数名字 和plt结合
    plt.title('what')
    plt.xlabel('month')
    plt.ylabel('high')
    t[:5].volume.plot(kind='pie',subplots= True,autopct='%.2f')
    plt.show()
箱型图 quoteslldf.boxplot(),具体去查资料吧
6.5.数据存取
存为csv
pd.to_csv("C:\\Desktop\\stock_cov.csv", index=True, sep=',') 读取csv
pd.read_csv()
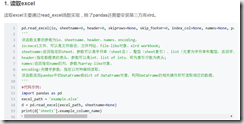
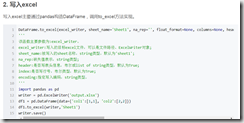
读写excel
pd.to_excel() pd.read_excel()
用pandas读写excel


6.6 python的理工应用
数学,生物Biopython,等等
图像处理
Pillow(PIL) OpenCV Skimage
6.7 python的人文社科
自然语言处理包NLTK库
箱型图:
    data1 = ts.get_hist_data('002033', start='2018-01-01')
    data1.boxplot()
    plt.show()
python音频处理:http://old.sebug.net/paper/books/scipydoc/wave_pyaudio.html


