nginx限速
第一步,先创建限制的规则,我这里直接在nginx默认的配置文件目录下配置,如果想自定义,需要在主配置文件添加include xx/xxx/xxx/*.conf配置
[root@node5 nginx]# cat conf.d/limit_zone.conf
geo $white_ip {
    default 1;
    include whiteip.conf;
}
map $white_ip $limited {
    1 $binary_remote_addr;
    0 "";
}
limit_req_status 418;
limit_conn_status 418;

limit_conn_zone $limited zone=addr:10m;
limit_req_zone $limited zone=one:5m rate=5r/s;
limit_req_zone $limited zone=two:5m rate=10r/s;
limit_req_zone $limited zone=three:5m rate=20r/s;
limit_req_zone $limited zone=four:5m rate=30r/s;
limit_req_zone $limited zone=five:5m rate=50r/s;
limit_req_zone $limited zone=ten:10m rate=100r/m;

limit_req_log_level error;
limit_conn_log_level error;
第二步,创建测试的html测试配置文件,这里的limit_req可以配置在server里也可以配置在location里,配置在server里的话作用于全局,配置在location里,只作用于某一个uri
[root@node5 nginx]# cat conf.d/test_limit.conf
server{
    listen          80;
    server_name     _;
    access_log      /var/log/nginx/logs/test_limit.log main;
    error_log      /var/log/nginx/logs/test_limit.log error;

    limit_req zone=two burst=5 nodelay;
    limit_req zone=ten burst=5 nodelay;
    #limit_rate 10M;
    location  / {
        root /html;
        autoindex on;
        autoindex_exact_size off;
        autoindex_localtime on;
    }
}
第三步,在nginx.conf主配置文件的同目录下,创建白名单,可以不受我们所配置的限制
[root@node5 nginx]# cat whiteip.conf
10.0.0.0/8 0;
60.205.246.14 0;
59.110.62.117 0;
59.110.49.218 0;
127.0.0.1 0;
第四步,重启
nginx -s reload
测试1:ab命令来测试,可以看到我们用127.0.0.1这个ip访问是没有问题的
[root@node5 nginx]# ab -c 100 -n 300 'http://127.0.0.1/'
This is ApacheBench, Version 2.3 <$Revision: 1430300 $>
Copyright 1996 Adam Twiss, Zeus Technology Ltd, http://www.zeustech.net/
Licensed to The Apache Software Foundation, http://www.apache.org/

Benchmarking 127.0.0.1 (be patient)
Completed 100 requests
Completed 200 requests
Completed 300 requests
Finished 300 requests


Server Software:        nginx/1.20.1
Server Hostname:        127.0.0.1
Server Port:            80

Document Path:          /
Document Length:        236 bytes

Concurrency Level:      100
Time taken for tests:   0.019 seconds
Complete requests:      300
Failed requests:        0
Write errors:           0
Total transferred:      107400 bytes
HTML transferred:       70800 bytes
Requests per second:    15714.21 [#/sec] (mean)
Time per request:       6.364 [ms] (mean)
Time per request:       0.064 [ms] (mean, across all concurrent requests)
Transfer rate:          5493.84 [Kbytes/sec] received

Connection Times (ms)
              min  mean[+/-sd] median   max
Connect:        0    1   0.5      1       2
Processing:     2    4   0.4      4       5
Waiting:        0    3   0.3      3       4
Total:          2    6   0.3      6       6

Percentage of the requests served within a certain time (ms)
  50%      6
  66%      6
  75%      6
  80%      6
  90%      6
  95%      6
  98%      6
  99%      6
 100%      6 (longest request)
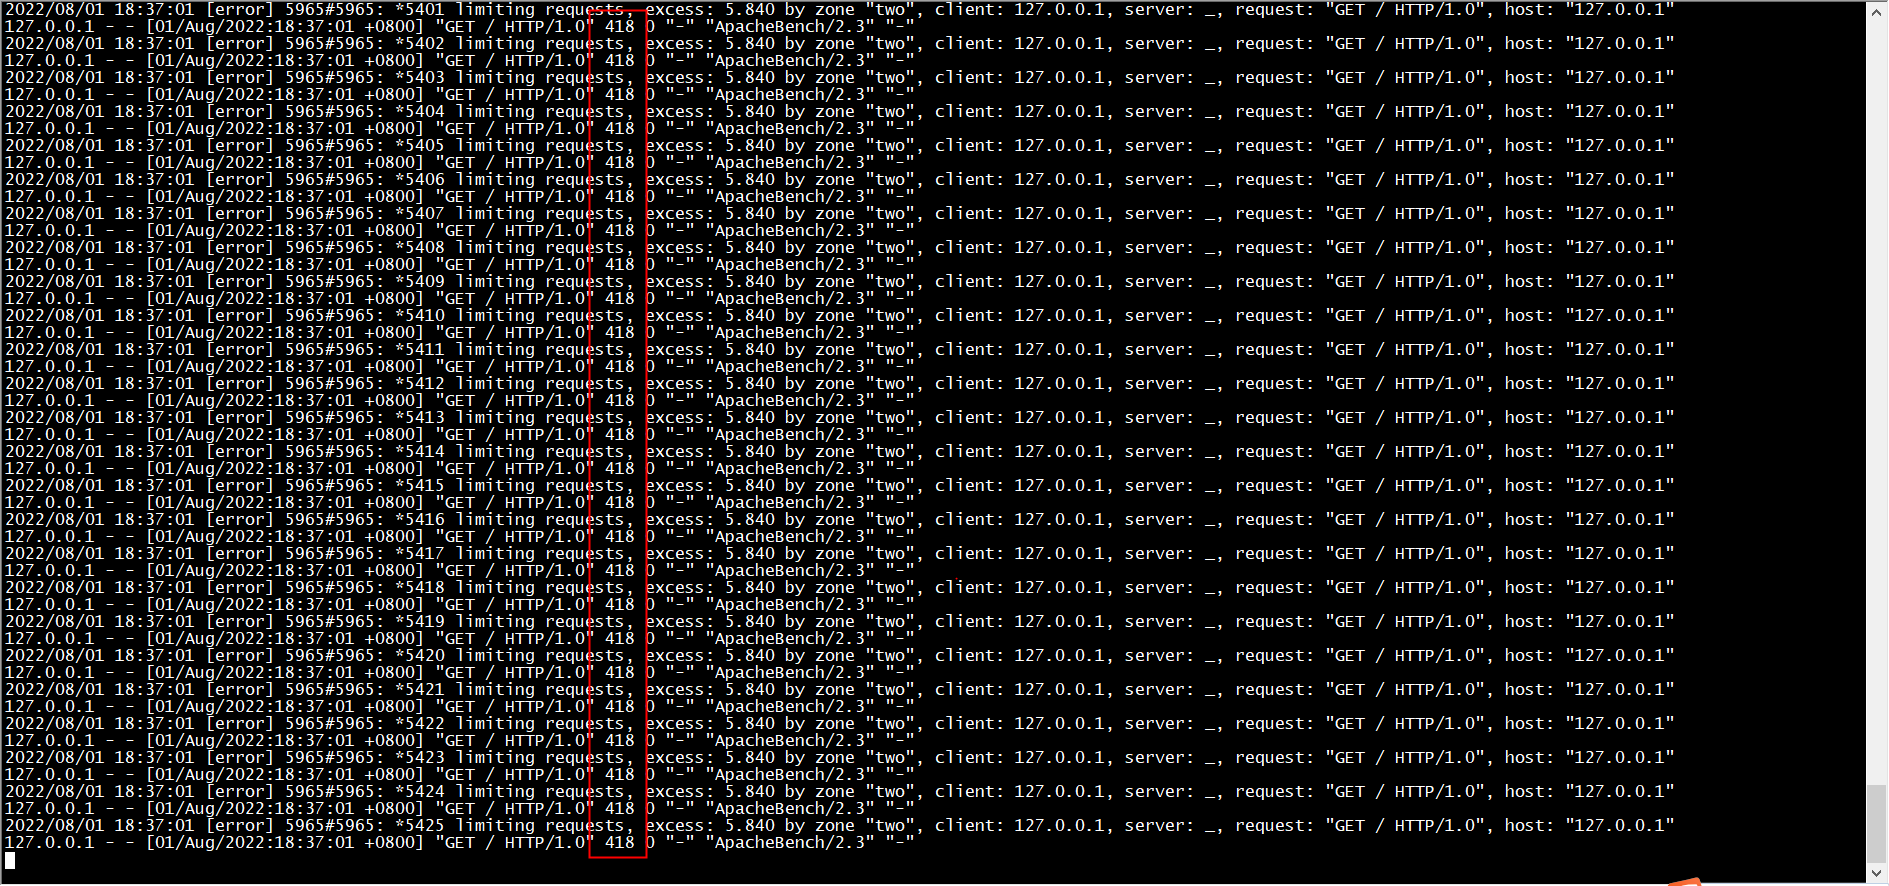
测试2:我们把白名单的参数从0改为1,之后nginx -s reload 在测试,可以看到并发如果过高就有失败的了,在去看日志
[root@node5 nginx]# cat whiteip.conf
10.0.0.0/8 0;
60.205.246.14 0;
59.110.62.117 0;
59.110.49.218 0;
127.0.0.1 1;
[root@node5 nginx]# ab -c 100 -n 300 'http://127.0.0.1/'
This is ApacheBench, Version 2.3 <$Revision: 1430300 $>
Copyright 1996 Adam Twiss, Zeus Technology Ltd, http://www.zeustech.net/
Licensed to The Apache Software Foundation, http://www.apache.org/

Benchmarking 127.0.0.1 (be patient)
Completed 100 requests
Completed 200 requests
Completed 300 requests
Finished 300 requests


Server Software:        nginx/1.20.1
Server Hostname:        127.0.0.1
Server Port:            80

Document Path:          /
Document Length:        236 bytes

Concurrency Level:      100
Time taken for tests:   0.018 seconds
Complete requests:      300
Failed requests:        294
   (Connect: 0, Receive: 0, Length: 294, Exceptions: 0)
Write errors:           0
Non-2xx responses:      294
Total transferred:      35664 bytes
HTML transferred:       1416 bytes
Requests per second:    17066.79 [#/sec] (mean)
Time per request:       5.859 [ms] (mean)
Time per request:       0.059 [ms] (mean, across all concurrent requests)
Transfer rate:          1981.35 [Kbytes/sec] received

Connection Times (ms)
              min  mean[+/-sd] median   max
Connect:        0    1   0.6      1       3
Processing:     3    4   0.4      4       5
Waiting:        0    3   0.3      3       3
Total:          3    5   0.5      5       6

Percentage of the requests served within a certain time (ms)
  50%      5
  66%      5
  75%      5
  80%      5
  90%      6
  95%      6
  98%      6
  99%      6
 100%      6 (longest request)
日志内容,418位设置的状态码