k8s集群监控并实现HPA自动扩缩容
部署metrics
kubernetes早期版本依靠Heapster来实现完整的性能数据采集和监控功能,k8s在1.8版本开始,性能数据开始以Metrics API的方式提供标准化接口,并且从1.10版本开始讲Heapster替换为Metrics Server,在新版本的Metrics当中可以对Node,Pod的cpu,内存的使用指标进行监控
我们可以先在k8s集群当中用kubectl top命令去尝试查看资源使用率,如下:
可以看到并不能查看资源,这是因为没有安装Metrics
[root@master redis]# kubectl top nodes
Error from server (NotFound): the server could not find the requested resource (get services http:heapster:)
Metrics部署文件在github上可以找到,如下:
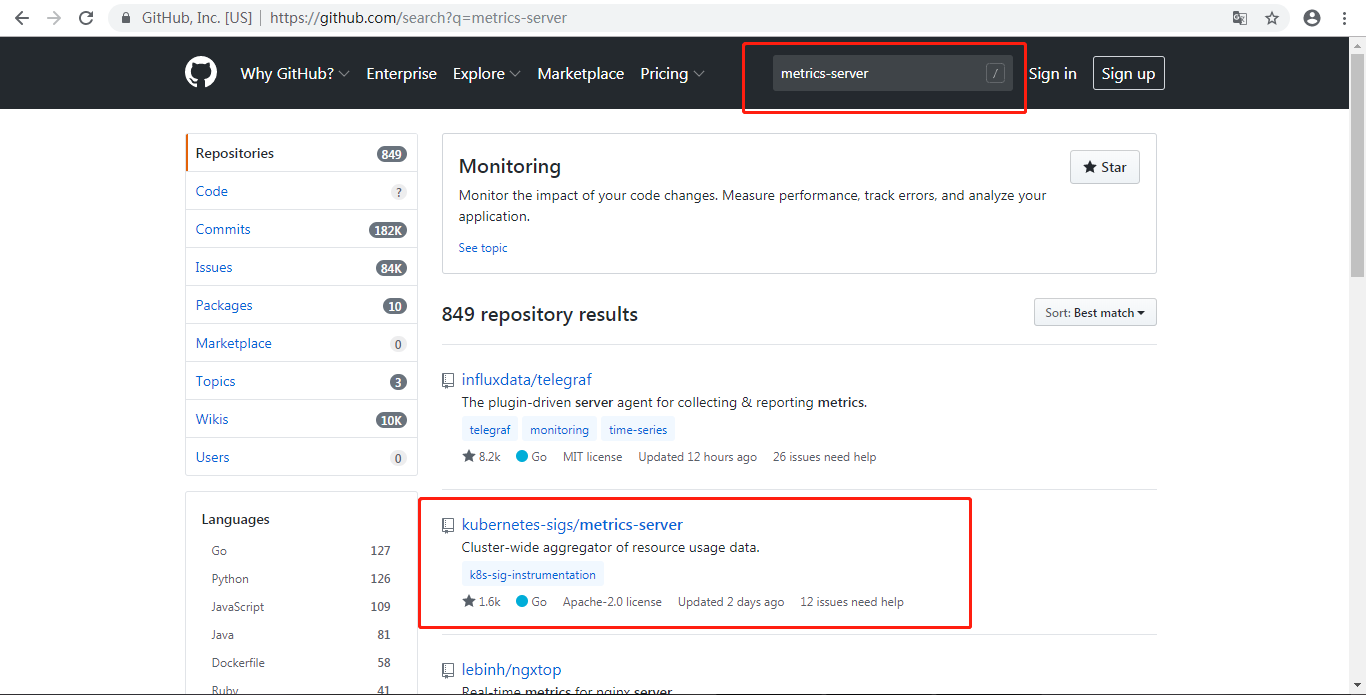
我们点进去然后把它的代码下载下来
[root@master test]# git clone https://github.com/kubernetes-sigs/metrics-server.git
正克隆到 'metrics-server'...
remote: Enumerating objects: 53, done.
remote: Counting objects: 100% (53/53), done.
remote: Compressing objects: 100% (43/43), done.
remote: Total 11755 (delta 12), reused 27 (delta 3), pack-reused 11702
接收对象中: 100% (11755/11755), 12.35 MiB | 134.00 KiB/s, done.
处理 delta 中: 100% (6113/6113), done.
进入部署代码目录
[root@master test]# cd metrics-server/deploy/kubernetes/
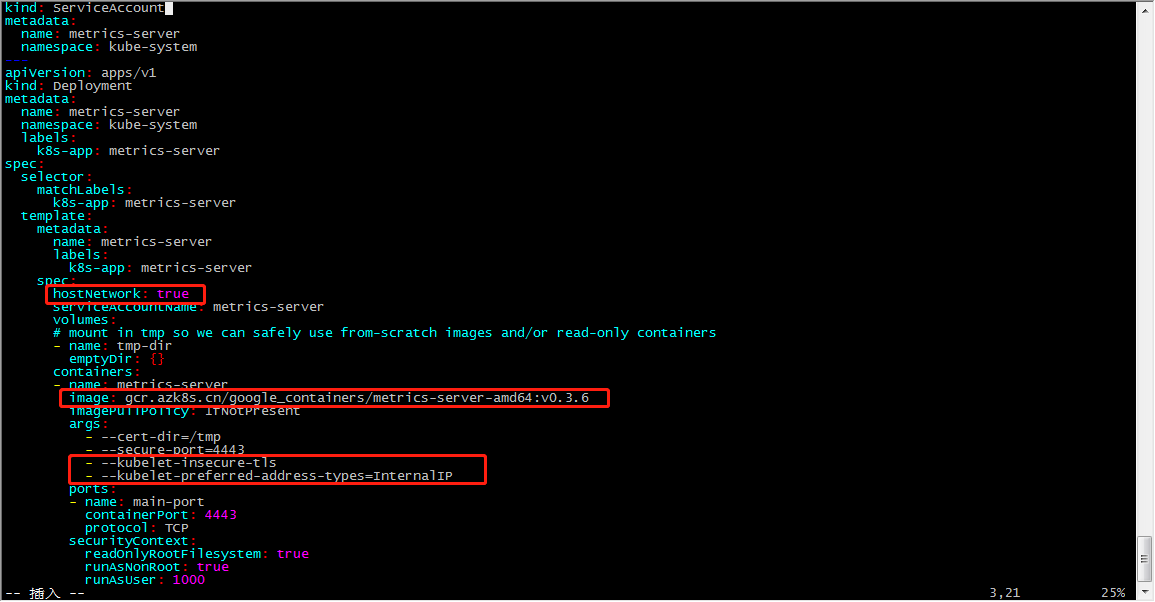
在metrics-server-deployment.yaml 我们需要添加如下4行内容
开始部署文件

[root@master kubernetes]# kubectl apply -f .
clusterrole.rbac.authorization.k8s.io/system:aggregated-metrics-reader created
clusterrolebinding.rbac.authorization.k8s.io/metrics-server:system:auth-delegator created
rolebinding.rbac.authorization.k8s.io/metrics-server-auth-reader created
apiservice.apiregistration.k8s.io/v1beta1.metrics.k8s.io created
serviceaccount/metrics-server created
deployment.apps/metrics-server created
service/metrics-server created
clusterrole.rbac.authorization.k8s.io/system:metrics-server created
clusterrolebinding.rbac.authorization.k8s.io/system:metrics-server created
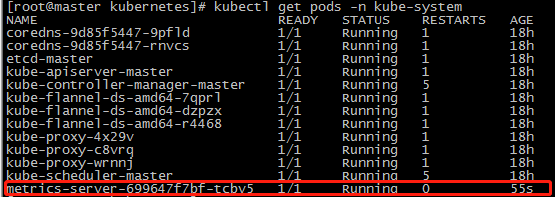
查看metrics pod的状态
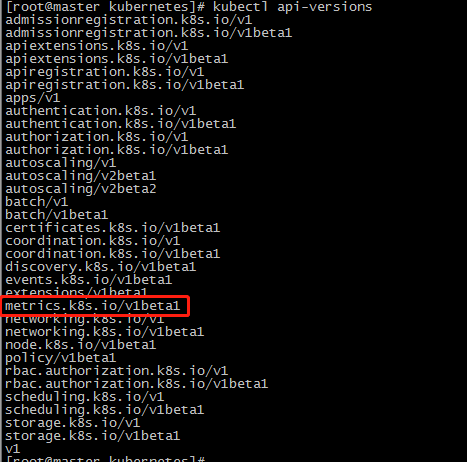
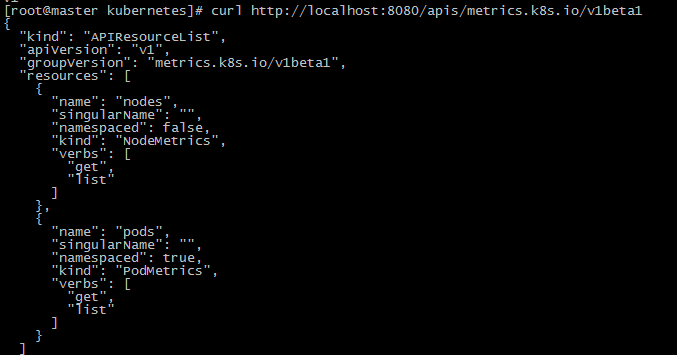
查看api
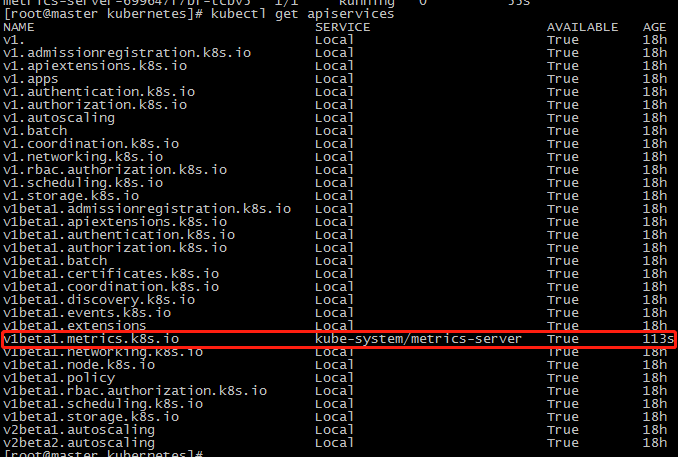
我们可以用kubectl proxy来尝试访问这个新的api
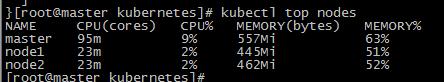
没有任何问题,接下来我们在去尝试用kubectl top命令,可以看到已经可以正常使用了
部署grafana+prometheus集群性能监控平台
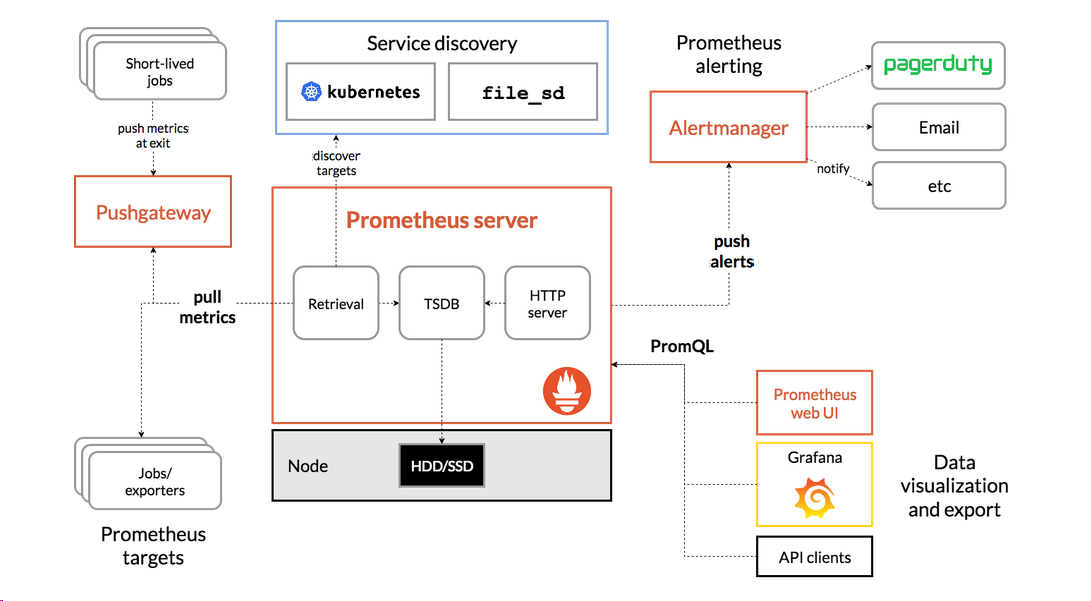
Prometheus是有SoundCloud公司开发的开源监控系统,是继kubernetes之后CNCF第二个毕业项目,在容器和微服务领域得到了广泛应用,Prometheus有以下特点:
- 使用指标名称及键值对标识的多维度数据模型
- 采用灵活的查询语言PromQL
- 不依赖分式存储,为自治的单节点服务
- 使用HTTP完成对监控数据的拉取
- 支持通过网关推送时序数据
- 支持多种图形和dashboard的展示,例如Grafana
prometheus架构图
开始部署第一步
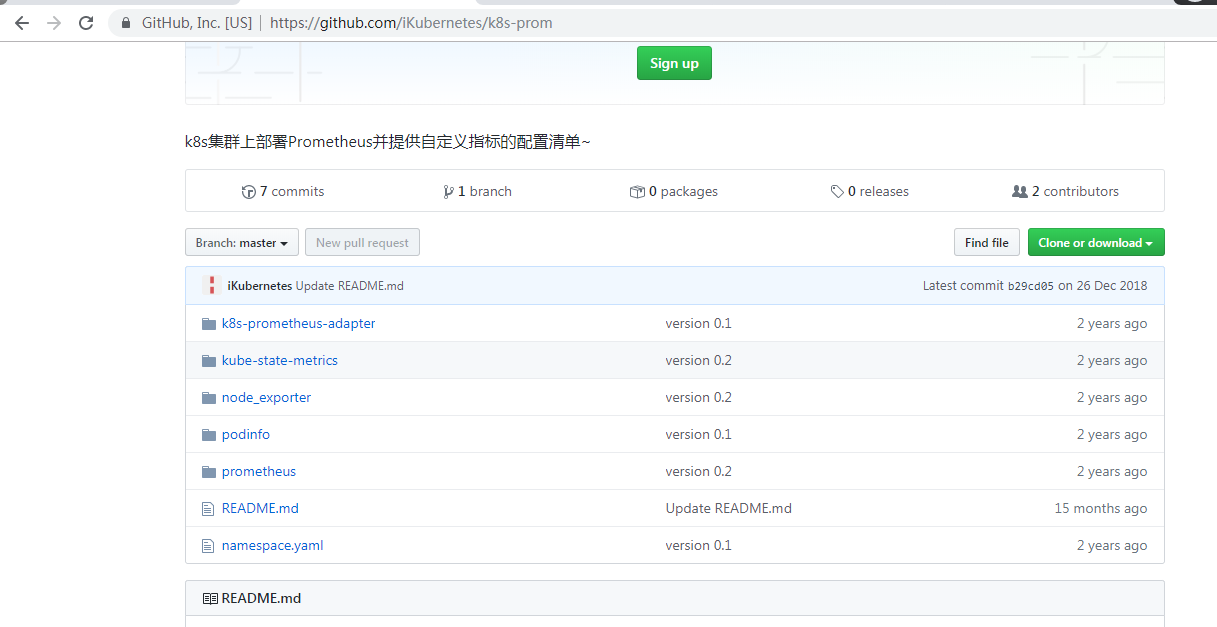
1.下载文件到本地
[root@master test]# git clone https://github.com/iKubernetes/k8s-prom.git
正克隆到 'k8s-prom'...
remote: Enumerating objects: 49, done.
remote: Total 49 (delta 0), reused 0 (delta 0), pack-reused 49
Unpacking objects: 100% (49/49), done.
2.创建名称空间
[root@master k8s-prom]# kubectl apply -f namespace.yaml
namespace/prom created
3.部署k8s-prom中的node_exporter/中的yaml文件来让prometheus获取数据
[root@master k8s-prom]# kubectl apply -f node_exporter/
daemonset.apps/prometheus-node-exporter created
service/prometheus-node-exporter created
4.部署prometheus/中的yaml文件
[root@master k8s-prom]# kubectl apply -f prometheus/
configmap/prometheus-config created
deployment.apps/prometheus-server created
clusterrole.rbac.authorization.k8s.io/prometheus created
serviceaccount/prometheus created
clusterrolebinding.rbac.authorization.k8s.io/prometheus created
service/prometheus created
5.部署k8s-prom中的k8s-prometheus-adapter/中的文件,但是由于这个文件中用的是http协议,但是我们k8s当中用的是https协议,所以在部署前需要创建秘钥
[root@master k8s-prom]# cd /etc/kubernetes/pki/
[root@master pki]# (umask 077;openssl genrsa -out serving.key 2048)
Generating RSA private key, 2048 bit long modulus
.....+++
.....................................+++
e is 65537 (0x10001)
[root@master pki]# openssl req -new -key serving.key -out serving.csr -subj "/CN=serving"
[root@master pki]# openssl x509 -req -in serving.csr -CA ./ca.crt -CAkey ./ca.key -CAcreateserial -out serving.crt -days 3650
Signature ok
subject=/CN=serving
Getting CA Private Key
[root@master pki]# kubectl create secret generic cm-adapter-serving-certs --from-file=serving.crt=./serving.crt --from-file=serving.key=./serving.key -n prom
secret/cm-adapter-serving-certs created
6.部署k8s-prom中的k8s-prometheus-adapter/中的文件
[root@master k8s-prom]# kubectl apply -f k8s-prometheus-adapter/
clusterrolebinding.rbac.authorization.k8s.io/custom-metrics:system:auth-delegator created
rolebinding.rbac.authorization.k8s.io/custom-metrics-auth-reader created
deployment.apps/custom-metrics-apiserver created
clusterrolebinding.rbac.authorization.k8s.io/custom-metrics-resource-reader created
serviceaccount/custom-metrics-apiserver created
service/custom-metrics-apiserver created
apiservice.apiregistration.k8s.io/v1beta1.custom.metrics.k8s.io created
clusterrole.rbac.authorization.k8s.io/custom-metrics-server-resources created
configmap/adapter-config created
clusterrole.rbac.authorization.k8s.io/custom-metrics-resource-reader created
clusterrolebinding.rbac.authorization.k8s.io/hpa-controller-custom-metrics created
7.部署kube-state-metrics中的yaml文件
[root@master k8s-prom]# kubectl apply -f kube-state-metrics/
8.部署grafana.yaml文件
$cat grafana.yaml
apiVersion: apps/v1
kind: Deployment
metadata:
  name: monitoring-grafana
  namespace: prom
spec:
  replicas: 1
  selector:
    matchLabels:
      task: monitoring
      k8s-app: grafana
  template:
    metadata:
      labels:
        task: monitoring
        k8s-app: grafana
    spec:
      containers:
      - name: grafana
        image: registry.cn-hangzhou.aliyuncs.com/k8s-kernelsky/heapster-grafana-amd64:v5.0.4
        ports:
        - containerPort: 3000
          protocol: TCP
        volumeMounts:
        - mountPath: /etc/ssl/certs
          name: ca-certificates
          readOnly: true
        - mountPath: /var
          name: grafana-storage
        env:
       # - name: INFLUXDB_HOST
       #   value: monitoring-influxdb
        - name: GF_SERVER_HTTP_PORT
          value: "3000"
          # The following env variables are required to make Grafana accessible via
          # the kubernetes api-server proxy. On production clusters, we recommend
          # removing these env variables, setup auth for grafana, and expose the grafana
          # service using a LoadBalancer or a public IP.
        - name: GF_AUTH_BASIC_ENABLED
          value: "false"
        - name: GF_AUTH_ANONYMOUS_ENABLED
          value: "true"
        - name: GF_AUTH_ANONYMOUS_ORG_ROLE
          value: Admin
        - name: GF_SERVER_ROOT_URL
          # If you're only using the API Server proxy, set this value instead:
          # value: /api/v1/namespaces/kube-system/services/monitoring-grafana/proxy
          value: /
      volumes:
      - name: ca-certificates
        hostPath:
          path: /etc/ssl/certs
      - name: grafana-storage
        emptyDir: {}
---
apiVersion: v1
kind: Service
metadata:
  labels:
    # For use as a Cluster add-on (https://github.com/kubernetes/kubernetes/tree/master/cluster/addons)
    # If you are NOT using this as an addon, you should comment out this line.
    kubernetes.io/cluster-service: 'true'
    kubernetes.io/name: monitoring-grafana
  name: monitoring-grafana
  namespace: prom
spec:
  # In a production setup, we recommend accessing Grafana through an external Loadbalancer
  # or through a public IP.
  # type: LoadBalancer
  # You could also use NodePort to expose the service at a randomly-generated port
  # type: NodePort
  ports:
  - port: 80
    targetPort: 3000
  selector:
    k8s-app: grafana
  type: NodePort
[root@master k8s-prom]# kubectl apply -f grafana.yaml
deployment.apps/monitoring-grafana created
service/monitoring-grafana created
9.验证各个pod运行无误
[root@master k8s-prom]# kubectl get ns
NAME              STATUS   AGE
default           Active   19h
kube-node-lease   Active   19h
kube-public       Active   19h
kube-system       Active   19h
prom              Active   10m
[root@master k8s-prom]# kubectl get pods -n prom
NAME                                        READY   STATUS    RESTARTS   AGE
custom-metrics-apiserver-7666fc78cc-xlnzn   1/1     Running   0          3m25s
monitoring-grafana-846dd49bdb-8gpkw         1/1     Running   0          61s
prometheus-node-exporter-45qxt              1/1     Running   0          8m28s
prometheus-node-exporter-6mhwn              1/1     Running   0          8m28s
prometheus-node-exporter-k6d7m              1/1     Running   0          8m28s
prometheus-server-69b544ff5b-9mk9x          1/1     Running   0          107s
[root@master k8s-prom]# kubectl get svc -n prom
NAME                       TYPE        CLUSTER-IP      EXTERNAL-IP   PORT(S)          AGE
custom-metrics-apiserver   ClusterIP   10.98.67.254    <none>        443/TCP          4m2s
monitoring-grafana         NodePort    10.102.49.116   <none>        80:30080/TCP     97s
prometheus                 NodePort    10.107.21.128   <none>        9090:30090/TCP   2m24s
prometheus-node-exporter   ClusterIP   None            <none>        9100/TCP         9m5s
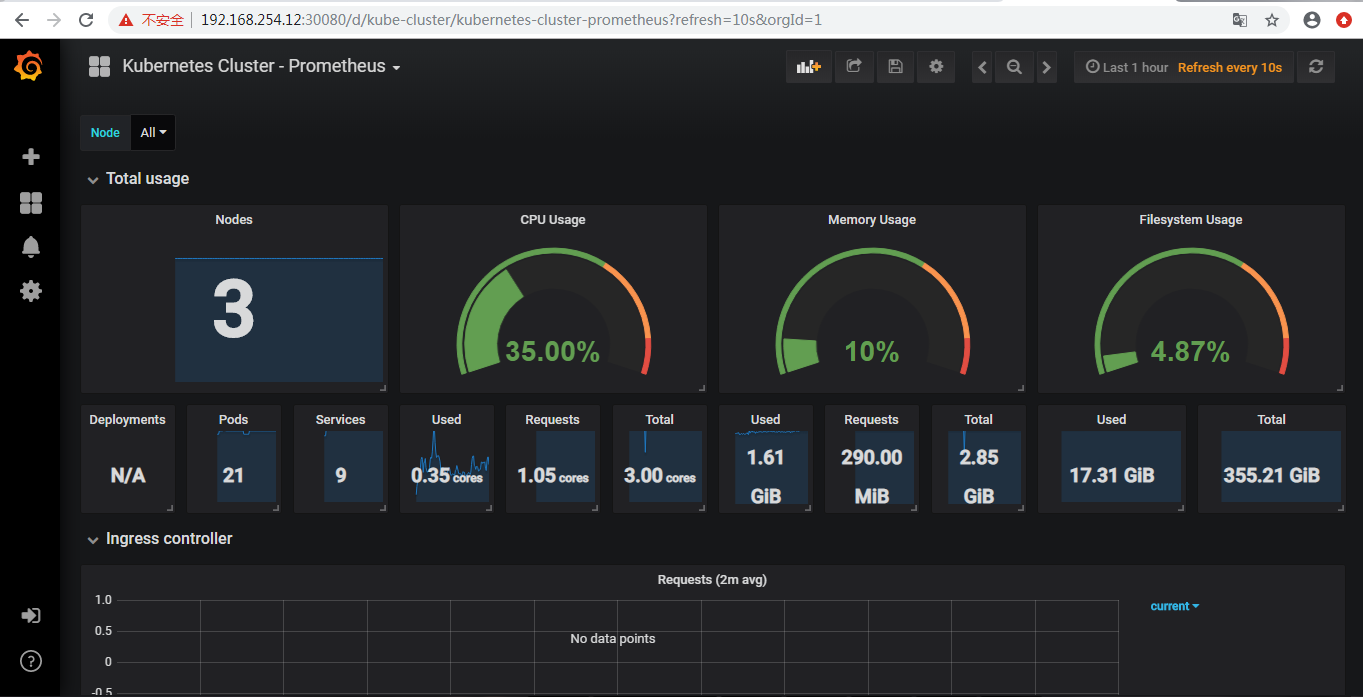
10.打开浏览器
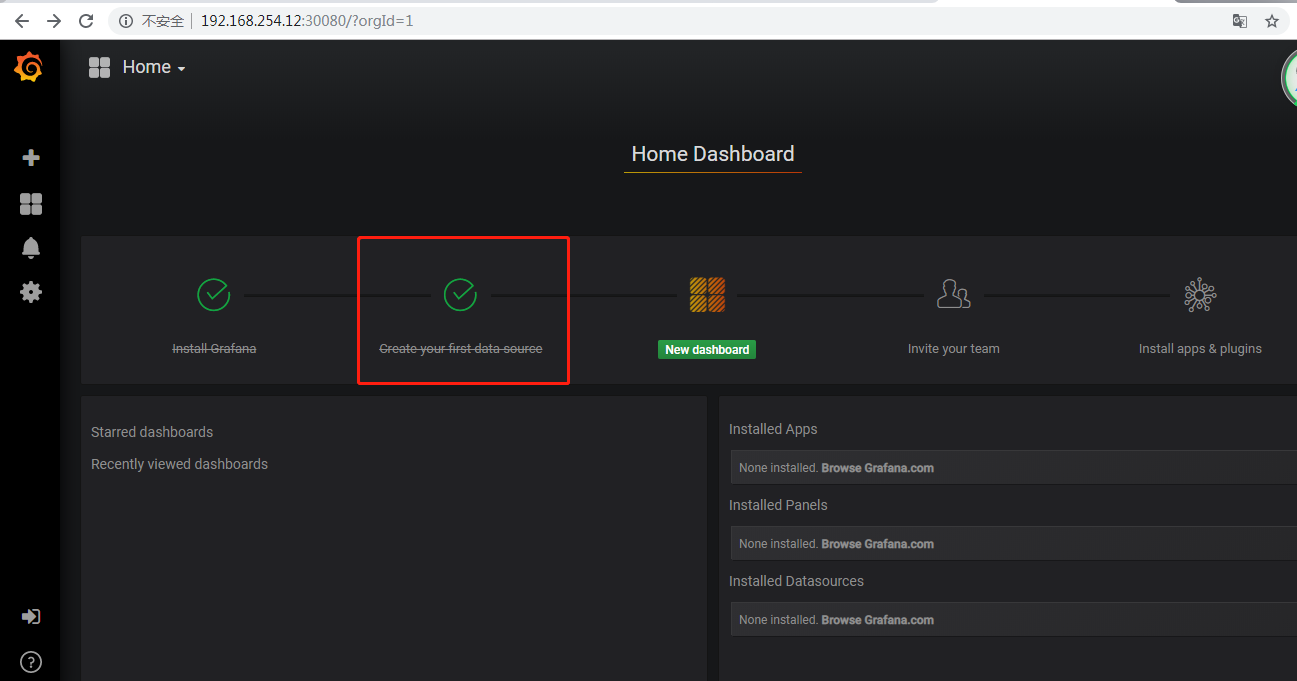
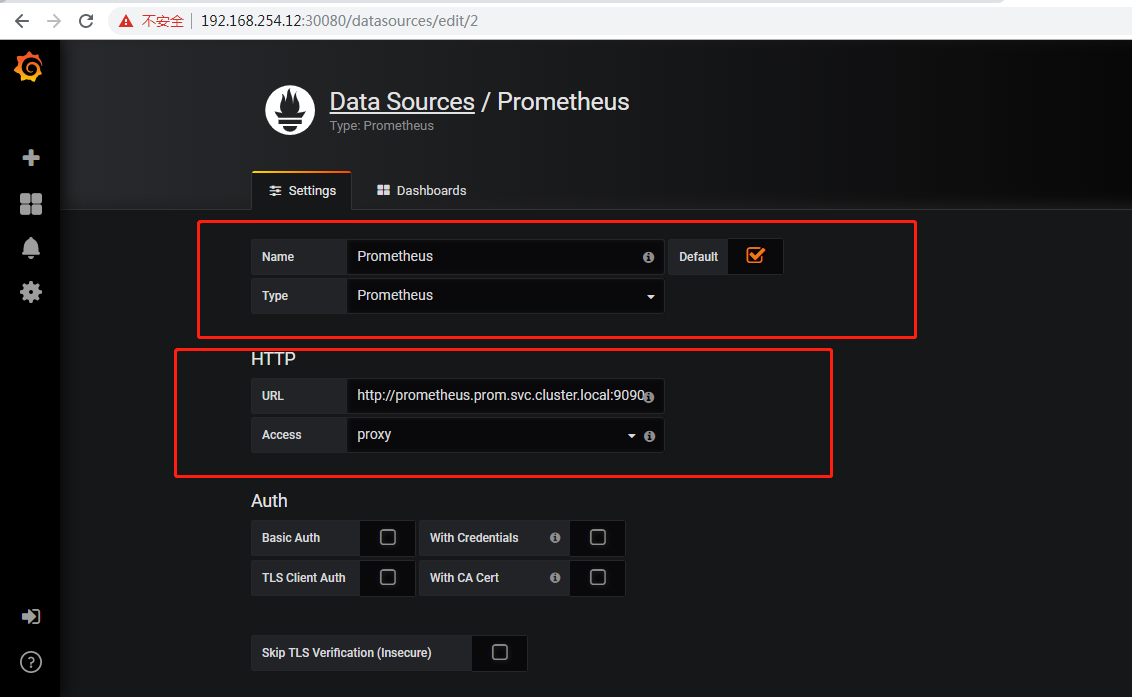
配置为
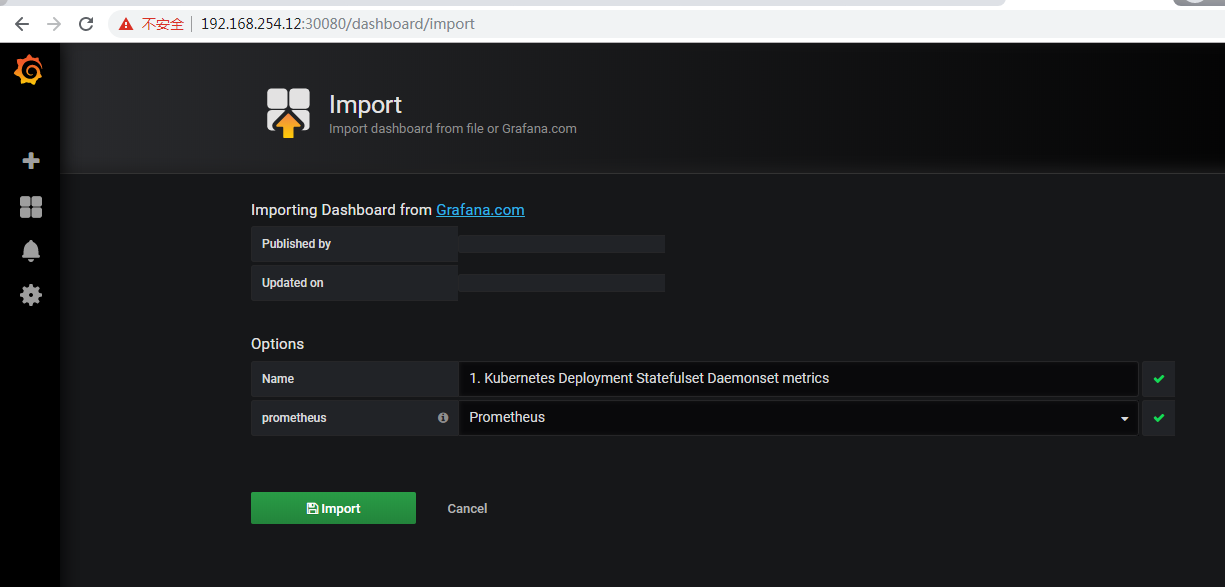
导入模板
创建HPA
动态扩缩容
创建1个pod
kubectl run myapp --image=liwang7314/myapp:v1 --replicas=1 --requests='cpu=50m,memory=50Mi' --limits='cpu=50m,memory=50Mi' --labels='app=myapp' --expose --port=80
创建hpa
kubectl autoscale deployment myapp --min=1 --max=8 --cpu-percent=60
使用ab工具压力测试,模拟100人访问50w次
ab -c 100 -n 500000 http://192.168.254.12:30958/index.html
观察pod数量
[root@master k8s-prom]# kubectl get pods -o wide -w
NAME                     READY   STATUS    RESTARTS   AGE     IP            NODE    NOMINATED NODE   READINESS GATES
myapp-54fbc848b4-7lf9m   1/1     Running   0          3m45s   10.244.1.32   node1   <none>           <none>
myapp-54fbc848b4-7v6fq   0/1     Pending   0          0s      <none>        <none>   <none>           <none>
myapp-54fbc848b4-7v6fq   0/1     Pending   0          1s      <none>        node2    <none>           <none>
myapp-54fbc848b4-7v6fq   0/1     ContainerCreating   0          1s      <none>        node2    <none>           <none>
myapp-54fbc848b4-7v6fq   1/1     Running             0          7s      10.244.2.42   node2    <none>           <none>
myapp-54fbc848b4-frrp2   0/1     Pending             0          0s      <none>        <none>   <none>           <none>
myapp-54fbc848b4-frrp2   0/1     Pending             0          1s      <none>        node1    <none>           <none>
myapp-54fbc848b4-6vttw   0/1     Pending             0          0s      <none>        <none>   <none>           <none>
myapp-54fbc848b4-6vttw   0/1     Pending             0          0s      <none>        node2    <none>           <none>
myapp-54fbc848b4-frrp2   0/1     ContainerCreating   0          1s      <none>        node1    <none>           <none>
myapp-54fbc848b4-6vttw   0/1     ContainerCreating   0          0s      <none>        node2    <none>           <none>
myapp-54fbc848b4-frrp2   1/1     Running             0          5s      10.244.1.33   node1    <none>           <none>
myapp-54fbc848b4-6vttw   1/1     Running             0          13s     10.244.2.43   node2    <none>           <none>
myapp-54fbc848b4-t5pgq   0/1     Pending             0          1s      <none>        <none>   <none>           <none>
myapp-54fbc848b4-t5pgq   0/1     Pending             0          4s      <none>        node1    <none>           <none>
myapp-54fbc848b4-lnmns   0/1     Pending             0          3s      <none>        <none>   <none>           <none>
myapp-54fbc848b4-jw8kp   0/1     Pending             0          4s      <none>        <none>   <none>           <none>
myapp-54fbc848b4-lnmns   0/1     Pending             0          4s      <none>        node2    <none>           <none>
myapp-54fbc848b4-jw8kp   0/1     Pending             0          5s      <none>        node1    <none>           <none>
myapp-54fbc848b4-t5pgq   0/1     ContainerCreating   0          9s      <none>        node1    <none>           <none>
myapp-54fbc848b4-lnmns   0/1     ContainerCreating   0          7s      <none>        node2    <none>           <none>
myapp-54fbc848b4-jw8kp   0/1     ContainerCreating   0          7s      <none>        node1    <none>           <none>
myapp-54fbc848b4-t5pgq   1/1     Running             0          11s     10.244.1.34   node1    <none>           <none>
查看HPA
[root@master ~]# kubectl describe hpa myapp
Name:                                                  myapp
Namespace:                                             default
Labels:                                                <none>
Annotations:                                           <none>
CreationTimestamp:                                     Sat, 14 Mar 2020 22:42:49 +0800
Reference:                                             Deployment/myapp
Metrics:                                               ( current / target )
  resource cpu on pods  (as a percentage of request):  100% (50m) / 60%
Min replicas:                                          1
Max replicas:                                          8
Deployment pods:                                       7 current / 7 desired
Conditions:
  Type            Status  Reason              Message
  ----            ------  ------              -------
  AbleToScale     True    ReadyForNewScale    recommended size matches current size
  ScalingActive   True    ValidMetricFound    the HPA was able to successfully calculate a replica count from cpu resource utilization (percentage of request)
  ScalingLimited  False   DesiredWithinRange  the desired count is within the acceptable range
Events:
  Type    Reason             Age    From                       Message
  ----    ------             ----   ----                       -------
  Normal  SuccessfulRescale  3m49s  horizontal-pod-autoscaler  New size: 2; reason: cpu resource utilization (percentage of request) above target
  Normal  SuccessfulRescale  2m47s  horizontal-pod-autoscaler  New size: 4; reason: cpu resource utilization (percentage of request) above target
  Normal  SuccessfulRescale  78s    horizontal-pod-autoscaler  New size: 7; reason: cpu resource utilization (percentage of request) above target


【推荐】国内首个AI IDE,深度理解中文开发场景,立即下载体验Trae
【推荐】编程新体验,更懂你的AI,立即体验豆包MarsCode编程助手
【推荐】抖音旗下AI助手豆包,你的智能百科全书,全免费不限次数
【推荐】轻量又高性能的 SSH 工具 IShell:AI 加持,快人一步
· Linux系列:如何用heaptrack跟踪.NET程序的非托管内存泄露
· 开发者必知的日志记录最佳实践
· SQL Server 2025 AI相关能力初探
· Linux系列:如何用 C#调用 C方法造成内存泄露
· AI与.NET技术实操系列(二):开始使用ML.NET
· 被坑几百块钱后,我竟然真的恢复了删除的微信聊天记录!
· 没有Manus邀请码?试试免邀请码的MGX或者开源的OpenManus吧
· 【自荐】一款简洁、开源的在线白板工具 Drawnix
· 园子的第一款AI主题卫衣上架——"HELLO! HOW CAN I ASSIST YOU TODAY
· Docker 太简单,K8s 太复杂?w7panel 让容器管理更轻松!