ELK-日志收集-Kibana WEB安全认证
1、ELK收集MYSQL日志实战:
日志收集存放目录位置:
/usr/local/logstash/config/etc/
1)日志采集-存入redis缓存数据库:mysql-redis.conf
input {
    file {
        type => "mysql-access"
        path => "/var/log/mysqld.log"
    }
}
output {
    redis {
        host => "192.168.1.12"
        port => 6379
        data——type => "list"
        key =>"logstash"
    }
}
启动mysql-redis.conf:
nohup /usr/local/logstash/bin/logstash -f mysql-redis.conf
ps -ef|grep java
2)Redis数据-存入ES:
input {
  redis {
    host => "localhost"
    port => "6379"
    data_type => "list"
    key => "logstash"
    type => "redis-input"
    batch_count => 1
  }
}
output {
    elasticsearch {
    hosts => "192.168.1.11"
  }
}
启动mysql-redis.conf:
nohup /usr/local/logstash/bin/logstash -f mysql-redis.conf
ps -ef|grep java
日志收集案例:nginx 可以写多个file, 也可以写多个文件(分开写),多个文件需要启动多次:
input {
    file {
        type => "nginx-access"
        path => "/usr/local/nginx/logs/access.log"
    }
}
output {
    elasticserch {
        hosts => "192.168.1.11:9200"
    }
}
2、日志分类:
tomcat日志:catalina.out
mysql日志:mysqld.log
nginx日志:access.log /error.log
zabbix日志:zabbix_server.log
内核日志:/var/log/dmesg
系统日志:/var/log/messages
邮件系统日志:/var/log/maillog
安全信息和系统登录、网络连接信息日志:/var/log/secure
记录现在登录的用户:/var/run/utmp
记录每个用户最后的登录信息:/var/log/lastlog
记录错误的登录尝试:/var/log/auth.log
........
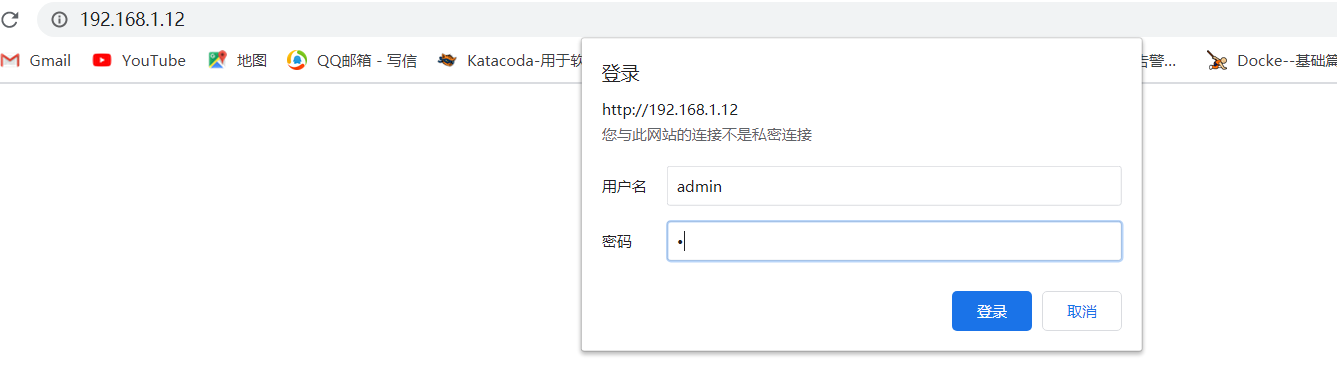
3、kibana WEB安全认证:
当我们安装完ES、kibana启动进程,可以直接在浏览器访问,这样不利于数据安全,接下来我们利用apache的密码认证进行安装配置。 通过访问nginx转发只ES和Kibana服务器,kibana服务器安装nginx:
wget http://nginx.org/download/nginx-1.16.0.tar.gz
tar xf nginx-1.16.0.tar.gz
useradd nginx
cd nginx-1.16.0
./configure --user=nginx --group=nginx --prefix=/usr/local/nginx --with-http_stub_status_module --with-http_ssl_module
make
make install
修改nginx.conf配置文件代码如下:
worker_processes  1;
events {
    worker_connections  1024;
}
http {
    include       mime.types;
    default_type  application/octet-stream;
    sendfile        on;
    keepalive_timeout  65;
    upstream  jvm_web1 {
    server    127.0.0.1:5601  weight=1  max_fails=2  fail_timeout=30s;
}
    server {
        listen  80;
        server_name  localhost;
        location / {
         proxy_set_header  Host  $host;
         proxy_set_header  X-Real-IP  $remote_addr;
         proxy_set_header X-Forwarded-For $proxy_add_x_forwarded_for;
         proxy_pass http://jvm_web1;
        }
    }
}
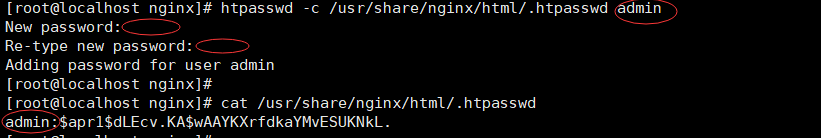
安装httpd-tools工具 会产生htpasswd工具:
yum install httpd-tools -y

设置认证用户名和密码:admin   *******
[root@localhost nginx]# htpasswd -c /usr/share/nginx/html/.htpasswd admin
New password:
Re-type new password:
Adding password for user admin
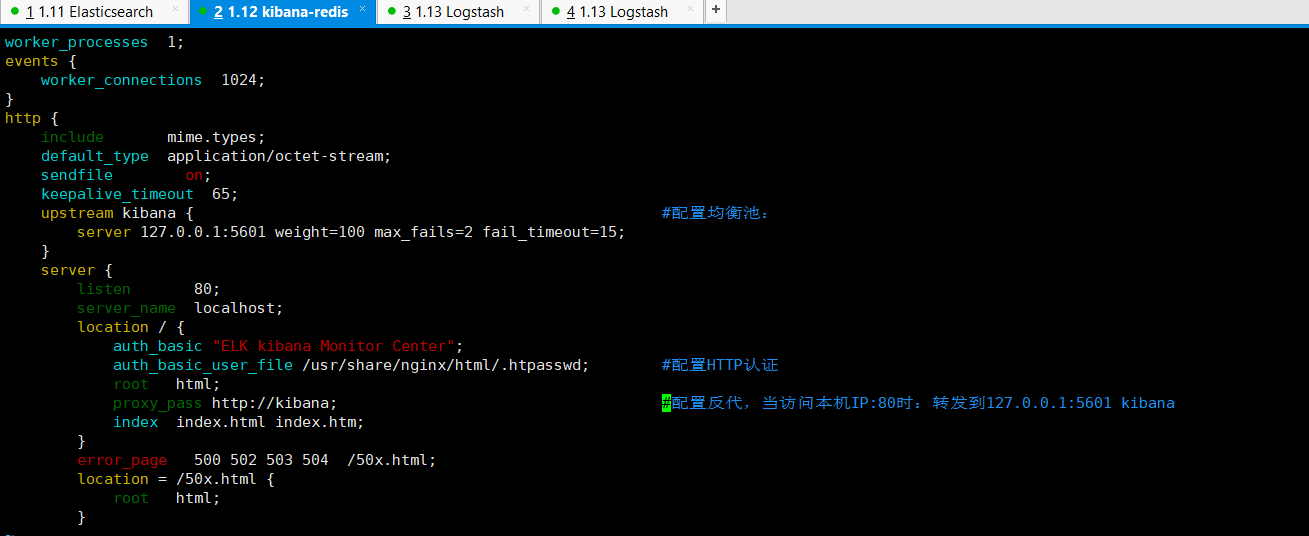
nginx配置文件修改为如下:
http 模块下添加:
    upstream kibana {                   #配置均衡池:
        server 127.0.0.1:5601 weight=100 max_fails=2 fail_timeout=15;
    }

server  模块下添加:
 auth_basic "ELK kibana Monitor Center";
 auth_basic_user_file /usr/share/nginx/html/.htpasswd;        #配置HTTP认证
proxy_pass http://kibana;           #配置反代,当访问本机IP:80时:转发到127.0.0.1:5601 kibana
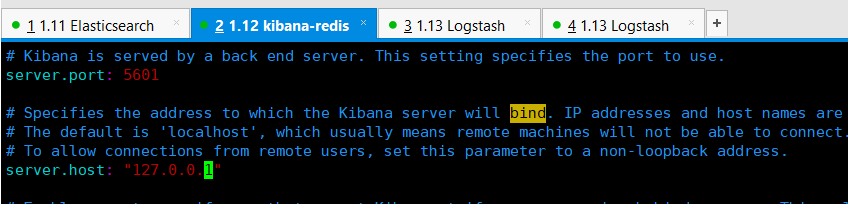
kibana配置文件:/usr/local/kibana/conf/kibana.yml 修改监听端口:127.0.0.1