matplotlib库的常用知识
看看matplotlib是什么?
https://www.cnblogs.com/yinheyi/p/6056314.html
matplotlib是python上的一个2D绘图库,它可以在夸平台上边出很多高质量的图像。综旨就是让简单的事变得更简单,让复杂的事变得可能。我们可以用matplotlib生成 绘图、直方图、功率谱、柱状图、误差图、散点图等 。
matplotlib的发明人为John Hunter(1968-2012),很不幸,他已经在癌症治疗过程中引起的综合症中去世。一代伟人有很多贡献,我们要缅怀他。如果我们从他的贡献中受益很大的话,请考虑为John Hunter Technology Fellowship 贡献你的力量。
下面的内容我们是基于matplotlib 版本1.5.3进行学习。
matplotlib在以后的工作与学习中有很大的用处,很有必要系统学习一下。
我的ipthon nootbook 中,当用plt.show()函数显示出来了图片,这时分把程序阻塞,然后关了figure之后,就可以继续运行,但是这时的上面所创建的figure与axes就相当于清除了。
在Ipython中,我们可能输入函数名加上??得到函数的源码;
matplotlib实际上为面向对象的绘图库,它所绘制的每个元素都有一个对象与之对应的。
figure就是一个图啦,axes表示图上的一个画图区域啦,一个图上可以有多个画图区域的啦,意思就是说,一个图上可以有多个子图啊。
用函数gcf()与gca()分别得到当前的figure与axes。(get current figure, get current axes).
利用sca()函数实现把一个axes对象作为当前的axes,如果你还想知道,如何把fiure对象作为当前的figure呢?直接输入figure(1)就可以换到figure1了,再说了,axes对象为figure对象的一个属性,当切换了axes,figure肯定也切换了啊。如:
plt.figure(1)         #建立figure(1)
plt.figure(2)         #建立figure(2)
ax1 = plt.subplot(2,1,1)
ax2 = plt.subplot(2,1,2)
plt.sca(ax1)         #切换到子图1
plt.sca(ax2)         #切换到子图2
plt.figure(1)        #切换到figure(1),它不是重建哦;
好啦,现在开始学习:
配置属性:
因为是面向对象的绘图库,我们可以为每个对象配置它们的属性,应该说有三个方法,一个是通过对象的方法set_属性名()函数,二是通过对象的set()函数,三是通过pylot模块提供的setp()函数:
plt.figure()
line = plt.plot(range(5))[0]  #plot函数返回的是一个列表,因为可以同时画多条线的哦;
line.set_color('r')
line.set_linewidth(2.0)
plt.show()
#————————————  或者  ————————————
plt.figure() line = plt.plot(range(5))[0] #plot函数返回的是一个列表,因为可以同时画多条线的哦;
line.set(color = 'g',linewidth = 2.0)plt.show()#———————————— 或者 ————————————plt.figure() lines = plt.plot(range(5),range(5),range(5),range(8,13)) #plot函数返回一个列表; plt.setp(lines, color = 'g',linewidth = 2.0) # setp函数可以对多条线进行设置的; plt.show()如果想查看呢,怎么办呢?同样两个方法,一个是通过对象的方法get_属性名()函数,一个是通过pylot模块提供的getp()函数。
getp()有两个调用方法,一个是只有要的查看的对象一个参数,一个是要查看的对象现属性两个参数;如:
plt.getp(line)
plt.getp(line, 'color'')
绘制子图:
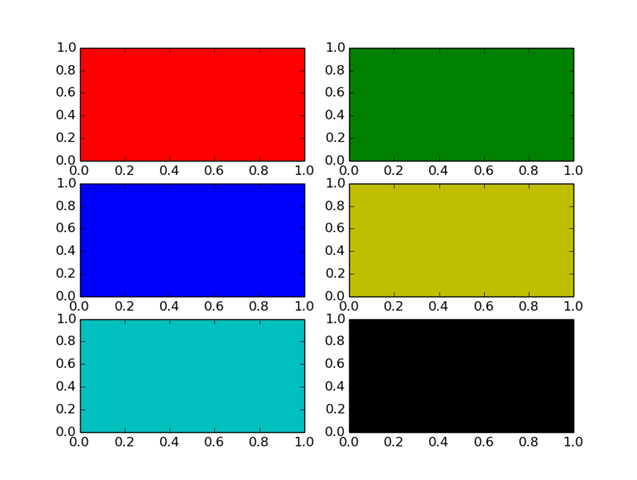
利用subplot()函数可以返回一个axes的对象哦,函数为:subplot(numRows, numCols, plotnum),当这三个参数都小于10时,我们可以把它们写一起,如下所示:
#subplot(numRows, numCols, plotnum)
for i, color in enumerate('rgbyck'):
    plt.subplot(321+i, axis_bgcolor = color)
plt.show()
利用subplot_adjust()函数可以对画的多个子图进行调整,它一共有left、right, bottom, top, wspace, hspase 六个参数,取 值从0至1。
对于上面的很多很多对象,其实都是Artist对象,Artist对象共分为简单类型和容器类型两种哦。简单的类型是标准的绘图元件,如:line2D, Rectangle, Text, AxesImage等。而容器类型则可以包含许多简单类型的Artist 对象,如 Figure,Axes,Axis等;
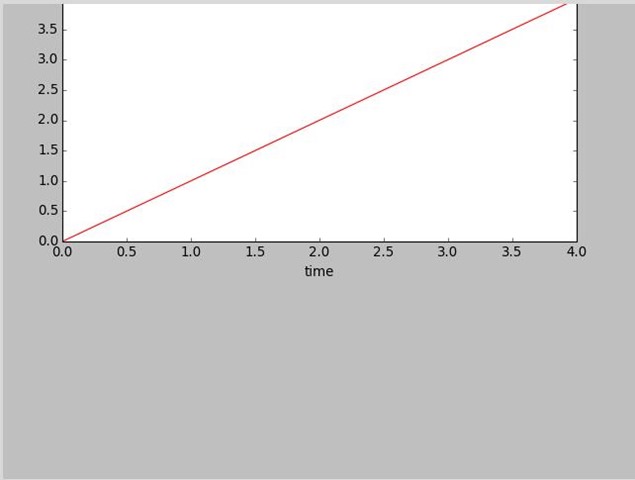
举一个建立简单Artist对象的过程哈,直接上代码:
import matplotlib.pyplot as plt
import numpy as np

fig = plt.figure(1)        # 创建了一个figure对象;

#figure对象的add_axes()可以在其中创建一个axes对象,
# add_axes()的参数为一个形如[left, bottom, width, height]的列表,取值范围在0与1之间;
ax = fig.add_axes([0.1, 0.5, 0.8, 0.5]) # 我们把它放在了figure图形的上半部分,对应参数分别为:left, bottom, width, height;
ax.set_xlabel('time')     #用axes对象的set_xlabel函数来设置它的xlabel

line =ax.plot(range(5))[0]  #用axes对象的plot()进行绘图,它返回一个Line2D的对象;
line.set_color('r')             # 再调用Line2D的对象的set_color函数设置color的属性;
plt.show()
输出 为:
figure容器:
在构成图表的各种Artist对象中,最上层的Artist对象是Figure。我们可以调用add_subplot()与add_axes()方法向图表中添加子图,它们分加到figure的axes的属性列表中。add_subplot()与add_axes()返回新创建的axes对象,分别为axesSuubplot与axes, axesSuubplot为 axes的派生类。另外,可以通过delaxes()方法来删除哦;
figure对象可以有自己的简单的artist对象。
下面列出Figure对象中包含的其他Artist对象的属性:
axes: Axes对象列表;
patch:作为背景的Rectangle对象;
images:FigureImage对象列表,用于显示图像;
legends:Legend 对象列表,用于显示图示;
lines: Line2D对象列表;
patches: Patch对象列表;
texts:Text 对象列表,用于显示文字;
axes容器:
它是整个matplotlib的核心,它包含了组成图表的众多的artist对象。并且有很多方法。我们常用的Line2D啦,Xaxis,YAxis等都是它的性哦;可以通过这个对象的属性来设置坐标轴的label啦,范围啦等之类的。干脆直接用plt.getp()查看它的属性,然后通过set_属性名()函数来设置就好啦。
axis容器:
axis容器包括了坐标轴上的刻度线、刻度标签等、坐标网络等内容。
对于坐标轴上的刻度相关的知识,它是这么分的:首先是major_ticks()和minor_ticks(), 然后呢,每个刻度又包括刻度线(ticklines)、刻度标签(ticklabels)、刻度位置(ticklocs)。本来呢,axis应该刻度,然后呢,刻度再包含那三个,但是呢,为了方便,axis就都包含了。其实也是有点交叉吧。上面的axes也会交叉包含它所包含对象的对象的。
看个例子:
plt.plot([1,2,3],[4,5,6])
axis = plt.gca().xaxis
axis.get_ticklocs()       #得到刻度位置;
axis.get_ticklabels()   #得到刻度标签;
axis.get_ticklines()   # 得到刻度线;
axis.get_ticklines(minor = True)   #得到次刻度线; 举个例子:就像我们的尺子上的厘米的为主刻度线,毫米的为次刻度线;
for label in axis.get_ticklabels():
    label.set_color('red')        #设置每个刻度标签的颜色;
    label.set_rotation(45)    #旋转45度;
    label.set_fontsize(16)     #设置字体大小;
for line in axis.get_ticklines():
    line.set_color('green')
    line.set_markersize(15)      #设置刻度线的长短;
    line.set_markeredgewidth(3)      #设置线的粗细
plt.show()
最后说一点哦:
pyplot函数提供了两个绘制文字的函数:text()和figtext()。它们分别调用了当前的Axes对象与当前的Figure对象的text()方法进行绘制文字。text()默认在数字坐标系(就是axes在的坐标系,用坐标轴的数字来表示坐标)中画, figtext()默认在图表坐标系(就是figure在图表中啦,坐标范围从0 到 1 )中画,我们可能通过trransform参数进行坐标系的转换。反正吧,matplotlib中一共有四种坐标系,并且可以转换的哦,提一下哈。
简单的调用:
plt.text(1, 1,'
hello,world', color = 'bule')   #还可以写更多参数的;
plt.figtexe(0.1, 0.8 ,"i am in figure', color = 'green')
上面说了一大堆了,现在说几个常用的画图函数吧:
那就从画简单的图开始喽:
plot(*args, *kwargs)函数,它可以画出很简单线图,基本用法:
plot(x, y)        # 画出横轴为x与纵轴为y的图,使用默认的线形与颜色;
plot(x, y, 'bo')  # 用蓝色,且点的标记用小圆,下面会解释哦
plot(y)           # 纵轴用y ,横轴用y的每个元素的坐标,即0,1,2……
plot(y, 'r+')     #
#如果其中x或y 为2D的,则会用它的相应的每列来表示哦,是每列哦,是每列哦,是每列哦,(重要的事情说三遍)plot(x1, y1, 'g^', x2, y2, 'g-')#看到了吗,我们可以使用多对的x, y, format 对当作变量的哦,把它们画一个图里;对于参数中,常用的format:线的颜色、线的形状、点的标记形状,我们用这三个的时候经常用缩写,它们之间的顺序怎么都可以哦,
如它俩一个意思:'r+--'、'+--r'。如果我们不想缩写的话,可以分别写成如: color='green', linestyle='dashed', marker='o'。
线的形状:
'-'    solid line style
'--'    dashed line style
'-.'    dash-dot line style
':'    dotted line style
点的标记:
'.'    point marker
','    pixel marker
'o'    circle marker
'v'    triangle_down marker
'^'    triangle_up marker
'<'    triangle_left marker
'>'    triangle_right marker
'1'    tri_down marker
'2'    tri_up marker
'3'    tri_left marker
'4'    tri_right marker
's'    square marker
'p'    pentagon marker
'*'    star marker
'h'    hexagon1 marker
'H'    hexagon2 marker
'+'    plus marker
'x'    x marker
'D'    diamond marker
'd'    thin_diamond marker
'|'    vline marker
'_'    hline marker
线的颜色:
‘b’ blue ‘g’ green ‘r’ red ‘c’ cyan ‘m’ magenta ‘y’ yellow ‘k’ black ‘w’ white常见线的属性有:color,labor,linewidth,linestyle,maker,等,具体要看全的话,见:http://matplotlib.org/api/lines_api.html#matplotlib.lines.Line2D。
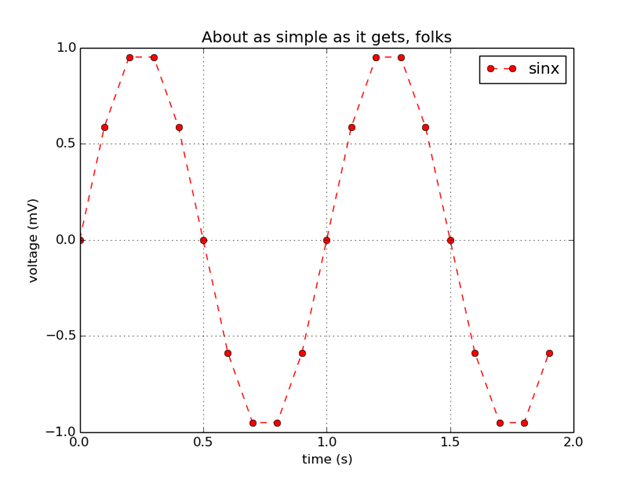
看一个例子:
import matplotlib.pyplot as plt
import numpy as np

plt.figure(1) #调用figure函数创建figure(1)对象,可以省略,这样那plot时,它就自动建一个啦;

t = np.arange(0.0, 2.0, 0.1)
s = np.sin(2*np.pi*t)
plt.plot(t, s, 'r--o', label = 'sinx')

plt.legend()  #显示右上角的那个label,即上面的label = 'sinx'
plt.xlabel('time (s)')    #设置x轴的label,pyplot模块提供了很直接的方法,内部也是调用的上面当然讲述的面向对象的方式来设置;
plt.ylabel('voltage (mV)')   #设置y轴的label;
#plt.xlim(-1,3)      #可以自己设置x轴的坐标的范围哦;
#plt.ylim(-1.5,1.5)   #同上;
plt.title('About as simple as it gets, folks')
plt.grid(True)   #显示网格;

plt.show()   #显示出figure;
函数subplots()
地
plt.subplots(nrows=1, ncols=1, sharex=False, sharey=False, squeeze=True, subplot_kw=None, **fig_kw)
#作用:创建一个已有subplots的figures;
参数:
      *nrows* : int  ,指创建的sublots的行数,默认为1.

      *ncols* : int  ,指创建的sublots的列数,默认为1.

     *sharex* : 为一个string或bool类型;
        当为Ture时,所有的subpots将要共享x轴,如果它们是上下的关系的话,上面的图的刻度label就没有,只有下面那个图的.
        If a string must be one of "row", "col", "all", or "none".
        "all" has the same effect as *True*, "none" has the same effect
        as *False*.
        If "row", each subplot row will share a X axis.
        If "col", each subplot column will share a X axis and the x tick
        labels on all but the last row will have visible set to *False*.

      *sharey* : 同上

      *squeeze* : bool  它是用来控制返回值的,根据返回的axis的结果决定要不要把没有的维度进行压缩一下.
           当为Ture时,如果返回的axis只有一个,则表示成标量,如果有一行或一列,则表示为一维数组,如果多行多列,则表示为2D数组;
           当为False时,不管多少个返回的axis,都以二维数组的方式返回;
      *subplot_kw* : dict
        Dict with keywords passed to the
        :meth:`~matplotlib.figure.Figure.add_subplot` call used to
        create each subplots.

      *fig_kw* : dict
        Dict with keywords passed to the :func:`figure` call.  Note that all
        keywords not recognized above will be automatically included here.

  返回值

  有两个fig和 axt(它是元组的方式哦)

      - *fig* is the :class:`matplotlib.figure.Figure` object

      - *ax* can be either a single axis object or an array of axis
        objects if more than one subplot was created.  The dimensions
        of the resulting array can be controlled with the squeeze
        keyword, see above.
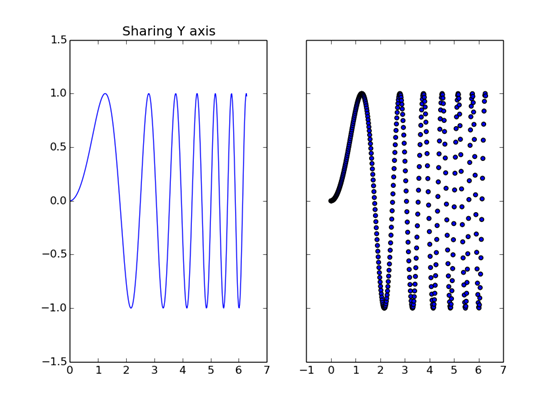
看个例子:
import matplotlib.pyplot as plt
f, (ax1, ax2) = plt.subplots(1, 2, sharey=True)
ax1.plot(x, y)
ax1.set_title('Sharing Y axis')
ax2.scatter(x, y)
plt.show()
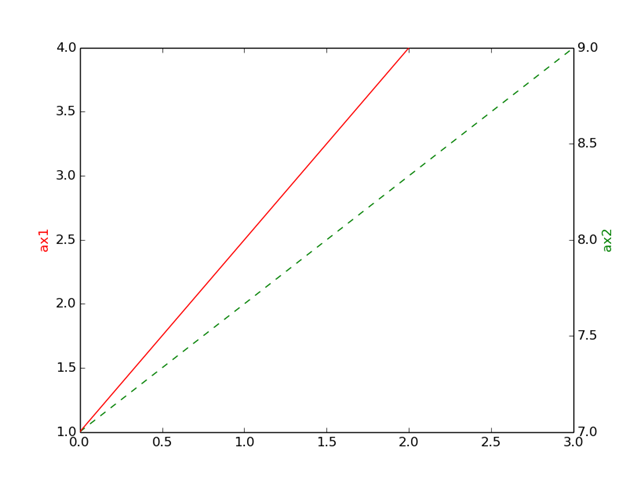
函数:twinx()或twiny()
它的作用就是:共享x轴,再给一个axis.看看牛逼的英文怎么说的:
create a twin of Axes for generating a plot with a sharex
x-axis but independent y axis. The y-axis of self will have
ticks on left and the returned axes will have ticks on the
right.
函数:twiny():和上面一样,不同之处在于,它共享y轴。
import matplotlib.pyplot as plt
fig = plt.figure(1)
ax1 =plt.subplot(111)
ax2 = ax1.twinx()
ax1.plot(np.arange(1,5),'g--')
ax1.set_ylabel('ax1',color = 'r')
ax2.plot(np.arange(7,10),'r-')
ax2.set_ylabel('ax2',color = 'g')
plt.show()
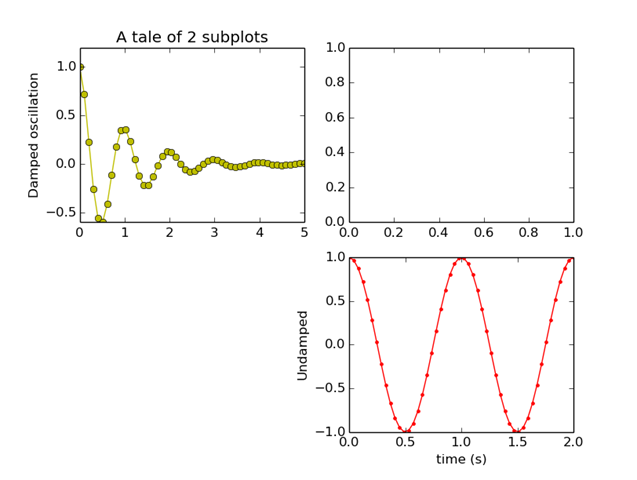
再写一个关于subplot的一个demo.
直接上代码:
"""
Simple demo with multiple subplots.
"""
import numpy as np
import matplotlib.pyplot as plt


x1 = np.linspace(0.0, 5.0)   #生成一个一维的array,linspace(起始点,结束点,点数(默认为50))
x2 = np.linspace(0.0, 2.0)

y1 = np.cos(2 * np.pi * x1) * np.exp(-x1)
y2 = np.cos(2 * np.pi * x2)

plt.subplot(2, 2, 1)      #表示在subplot为2*1的样式,并在第一个子图上画出;
plt.plot(x1, y1, 'yo-')
plt.title('A tale of 2 subplots')
plt.ylabel('Damped oscillation')

plt.subplot(2, 2, 2)      #  我们在第二个子图上加个空图哈,去理解它的图的排序(即注意第二个子图的位置
                                    #  为第一行第二列)是按行优先的,这个正好和matlab里相反哦;

plt.subplot(2, 2, 4)
plt.plot(x2, y2, 'r.-')
plt.xlabel('time (s)')
plt.ylabel('Undamped')

plt.show()
再来瞧瞧直方图。
n, bins, patches = hist(x, bins=10, range=None, normed=False, weights=None, cumulative=False, bottom=None, histtype='bar', align='mid', orientation='vertical', rwidth=None, log=False, color=None, label=None, stacked=False, hold=None, data=None, **kwargs)
参数的意义:
x : (n,) array or sequence of (n,) arrays,表示:就是输入的数据啦,可以为一个序列数,也可以多组;
bins : integer or array_like, 表示:控制分的块数,要分的块数为bins,默认为10;
range : tuple or None, optional, 表示画图的范围大小 ;详细你们看英语哈;
The lower and upper range of the bins. Lower and upper outliers are ignored. If not provided,
rangeis (x.min(), x.max()). Range has no effect ifbinsis a sequence.If
binsis a sequence orrangeis specified, autoscaling is based on the specified bin range instead of the range of x.Default is
Nonenormed : boolean, optional, 意义就是说,返回的第一个n(后面解释它的意义)吧,把它们正则化它,让bins的值 的和为1,这样差不多相当于概率分布似的了;
If
True, the first element of the return tuple will be the counts normalized to form a probability density, i.e.,n/(len(x)`dbin), i.e., the integral of the histogram will sum to 1. If stacked is also True, the sum of the histograms is normalized to 1.Default is
Falseweights : (n, ) array_like or None, optional 啥意义啊,不知道 哦
An array of weights, of the same shape as
x. Each value inxonly contributes its associated weight towards the bin count (instead of 1). Ifnormedis True, the weights are normalized, so that the integral of the density over the range remains 1.Default is
Nonecumulative : boolean, optional ,就是每一列都把之前的加起来,可能这么说不严谨哦,不过就是那个意思;
If
True, then a histogram is computed where each bin gives the counts in that bin plus all bins for smaller values. The last bin gives the total number of datapoints. Ifnormedis alsoTruethen the histogram is normalized such that the last bin equals 1. Ifcumulativeevaluates to less than 0 (e.g., -1), the direction of accumulation is reversed. In this case, ifnormedis alsoTrue, then the histogram is normalized such that the first bin equals 1.Default is
Falbottom : array_like, scalar, or None,下面的每个bin的基线,表示bin的值都从这个基线上往上加;
Location of the bottom baseline of each bin. If a scalar, the base line for each bin is shifted by the same amount. If an array, each bin is shifted independently and the length of bottom must match the number of bins. If None, defaults t
Default is
Nonehisttype : {‘bar’, ‘barstacked’, ‘step’, ‘stepfilled’}, optional, 表明了画出的bar的形状;
The type of histogram to draw.
‘bar’ is a traditional bar-type histogram. If multiple data are given the bars are aranged side by side.
‘barstacked’ is a bar-type histogram where multiple data are stacked on top of each other.
‘step’ generates a lineplot that is by default unfilled.
‘stepfilled’ generates a lineplot that is by default filled.
Default is ‘bar’
align : {‘left’, ‘mid’, ‘right’}, optional 它决定了你画的bar是以什么为中心的。你看看哈,画图时,每个bin的边界已经分好了,align就决定了你画每一个bar时,要依左边界为中心呢,还是右边界,还是中间呢?当然默认为中间了,这样才准确的
Controls how the histogram is plotted.
- ‘left’: bars are centered on the left bin edges.
- ‘mid’: bars are centered between the bin edges.
- ‘right’: bars are centered on the right bin edges.
Default is ‘mid’
orientation : {‘horizontal’, ‘vertical’}, optional:指的方向,分为水平与垂直两个方向。
If ‘horizontal’,
barhwill be used for bar-type histograms and the bottom kwarg will be the left edges.rwidth : scalar or None, optional ,控制你要画的bar 的宽度哦;
The relative width of the bars as a fraction of the bin width. If
None, automatically compute the width.Ignored if
histtypeis ‘step’ or ‘stepfilled’.Default is
Nonelog : boolean, optional
If
True, the histogram axis will be set to a log scale. IflogisTrueandxis a 1D array, empty bins will be filtered out and only the non-empty (n,bins,patches) will be returned.Default is
Falsecolor : color or array_like of colors or None, optional 表示bar的颜色;
Color spec or sequence of color specs, one per dataset. Default (
None) uses the standard line color sequence.Default is
Nonelabel : string or None, optional 这个不错,可以给图上画的加个标签,要加上这么一句哦;plt.legend() 作用为显示出来;
String, or sequence of strings to match multiple datasets. Bar charts yield multiple patches per dataset, but only the first gets the label, so that the legend command will work as expected.
default is
Nonestacked : boolean, optional 作用就是当多个输入的时候,要不要把它们luo 起来;
If
True, multiple data are stacked on top of each other IfFalsemultiple data are aranged side by side if histtype is ‘bar’ or on top of each other if histtype is ‘step’Default is
False
输出参数:
n : array or list of arrays 每一个 bin的值;
The values of the histogram bins. See normed and weights for a description of the possible semantics. If input x is an array, then this is an array of length nbins. If input is a sequence arrays
[data1, data2,..], then this is a list of arrays with the values of the histograms for each of the arrays in the same order.bins : array :返回bin的边界值,长度为bin的数目 + 1.
The edges of the bins. Length nbins + 1 (nbins left edges and right edge of last bin). Always a single array even when multiple data sets are passed in.
patches : list or list of lists
Silent list of individual patches used to create the histogram or list of such list if multiple input datasets.
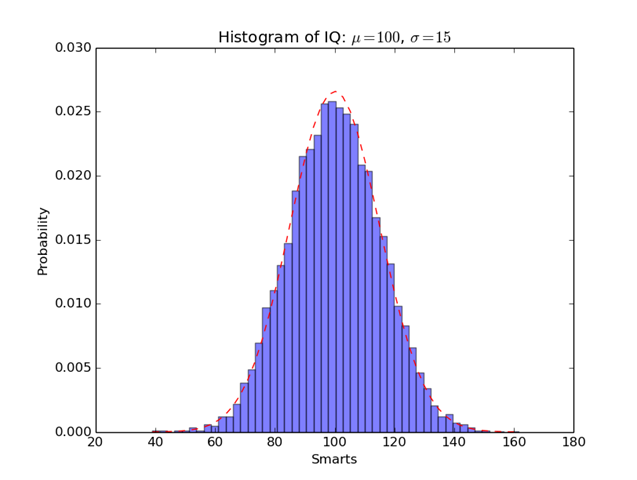
来,看个图:import numpy as np import matplotlib.mlab as mlab import matplotlib.pyplot as plt # example data mu = 100 # mean of distribution sigma = 15 # standard deviation of distribution x = mu + sigma * np.random.randn(10000) #np.random.randn(n)函数的作用为生成n个标准的正态分布的数; num_bins = 50 # the histogram of the data n, bins, patches = plt.hist(x, bins = num_bins, normed=1, color='b', alpha=0.5) # add a 'best fit' line y = mlab.normpdf(bins, mu, sigma) # normpdf(x,mu,sigma):返回参数为μ和σ的正态分布密度函数在x处的值 # (其中参数mu是μ,参数sigma是σ) plt.plot(bins, y, 'r--') plt.xlabel('Smarts') plt.ylabel('Probability') plt.title(r'Histogram of IQ: $\mu=100$, $\sigma=15$') # Tweak spacing to prevent clipping of ylabel plt.subplots_adjust(left=0.15) #把画的图从左边0.15(整个为1)处开始, 要不把y轴的label显示不出来 ,可以设为0试试. # 另外,其实不加也没事; plt.show()
再来看一个饼形图:
函数pie()如下所示,它画出数组x表示的饼形图,每一份的比例为x/sum(x);如果sum(x)的和小于1,那么,直接用x的值当作比例哦,不会去标准化它。默认的块是逆时针来的,从x轴开始。
pie(x, explode=None, labels=None,
    colors=('b', 'g', 'r', 'c', 'm', 'y', 'k', 'w'),
    autopct=None, pctdistance=0.6, shadow=False,
    labeldistance=1.1, startangle=None, radius=None,
    counterclock=True, wedgeprops=None, textprops=None,
    center = (0, 0), frame = False, hold = None, data = None )
参数的意义:
explode: [ None | len(x) sequence ] 为None或着长度为len(x)的数的序列,表明每一块中心与圆心的位移,基本都是小数哦,意思就是让每一块分开一定距离,这样好看;
If not None, is a len(x) array which specifies the fraction of the radius with which to offset each wedge.
colors: [ None | color sequence ] 表示每一块的颜色;
A sequence of matplotlib color args through which the pie chart will cycle.
labels: [ None | len(x) sequence of strings ] 表示每一块的标签;
A sequence of strings providing the labels for each wedge
autopct: [ None | format string | format function ] ,用于标记它们的值(大小为x/sum(x)*100);,可以为一个format string,或function。如format string, %d(整数),%1.1f(保留一位的小数)等
If not None, is a string or function used to label the wedges with their numeric value. The label will be placed inside the wedge. If it is a format string, the label will be fmt%pct. If it is a function, it will be called.
pctdistance: scalar ,用于控制上面的那个autopct生成的显示的值 的位置,默认离每一块的中心0.6的比例处;
The ratio between the center of each pie slice and the start of the text generated by autopct. Ignored if autopct is None; default is 0.6.
labeldistance: scalar 控制那个label的位置,它代表了径向的相对距离哦;
The radial distance at which the pie labels are drawn
shadow: [ False | True ] 要不要画个阴影呢?它决定!!!
Draw a shadow beneath the pie.
startangle: [ None | Offset angle ] 开始的位置偏移的角度;
If not None, rotates the start of the pie chart by angle degrees counterclockwise from the x-axis.
radius: [ None | scalar ] The radius of the pie, if radius is None it will be set to 1. 直径的大小;
counterclock: [ False | True ] 逆时针还是顺时针呢;
Specify fractions direction, clockwise or counterclockwise.
wedgeprops: [ None | dict of key value pairs ] 用字典属性指定了块的一些属性;
Dict of arguments passed to the wedge objects making the pie. For example, you can pass in wedgeprops = { ‘linewidth’ : 3 } to set the width of the wedge border lines equal to 3. For more details, look at the doc/arguments of the wedge object. By default clip_on=False.
textprops: [ None | dict of key value pairs ] 用字典属性指定了text的属性;
Dict of arguments to pass to the text objects.
center: [ (0,0) | sequence of 2 scalars ] Center position of the chart. 它的中心位置啦;
frame: [ False | True ] 它决定了你要不要显示坐标轴哦;
Plot axes frame with the chart.
另外还有两个参数:
In addition to the above described arguments, this function can take a data keyword argument. If such a data argument is given, the following arguments are replaced by data[<arg>]:

All arguments with the following names: ‘x’, ‘labels’, ‘colors’, ‘explode’.
Additional kwargs: hold = [True|False] overrides default hold state
返回值:
If autopct is None, return the tuple (patches, texts):

patches is a sequence of matplotlib.patches.Wedge instances
texts is a list of the label matplotlib.text.Text instances.
If autopct is not None, return the tuple (patches, texts, autotexts), where patches and texts are as above, and autotexts is a list of Text instances for the numeric labels.
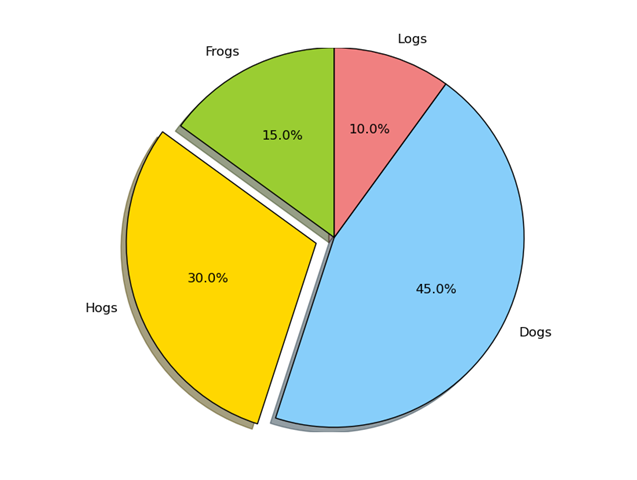
说了一大堆了,来举个例子啦:
import matplotlib.pyplot as plt

# The slices will be ordered and plotted counter-clockwise.
labels = 'Frogs', 'Hogs', 'Dogs', 'Logs'
sizes = [15, 30, 45, 10]
colors = ['yellowgreen', 'gold', 'lightskyblue', 'lightcoral']   #这个颜色有点牛逼;
explode = (0, 0.1, 0, 0)  # only "explode" the 2nd slice (i.e. 'Hogs')

plt.pie(sizes, explode=explode, labels=labels, colors=colors,
        autopct='%1.1f%%', shadow=True, startangle=90)
# Set aspect ratio to be equal so that pie is drawn as a circle.
plt.axis('equal')  #让坐标的横轴与纵轴相等,这样圆才是圆的哦,目的好看啊.
plt.show()
来,再来学习画3D图形啦。mplot3d rutorial
mpl_toolkits.mplot3d模块在matplotlib基础上提供了三维绘图的功能。由于它使用matplotlib的二维绘图功能来实现三维的图形的绘制工作,所以呢,速度是有限滴,不过呢,对于我们平时画个小图啦,是绰绰有余的。现在开始学习啦!
首先我们开始的话,就要创建一个Axes3D对象:现在吧,我们是基于version1.5.1来说的哦:
import matplotlib.pyplot as plt
from mpl_toolkits.mplot3d import Axes3D
fig = plt.figure()
ax = fig.add_subplot(111, projection='3d')
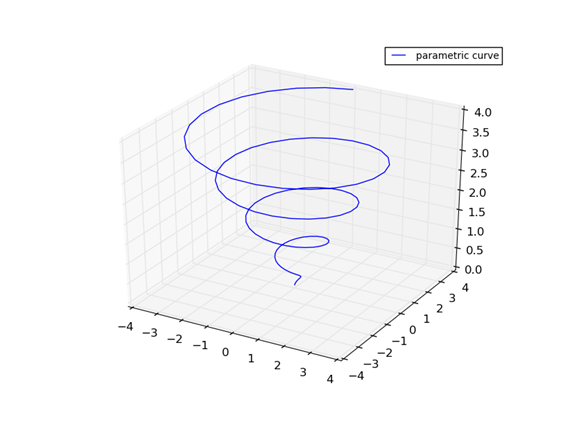
画三维曲线图:
Axes3D.plot(self, xs, ys, *args, **kwargs):
         =====  ================================================
        Argument    Description
        ==========  ================================================
        *xs*, *ys*  X, y coordinates of vertices

        *zs*        z value(s), either one for all points or one for
                    each point.
        *zdir*      Which direction to use as z ('x', 'y' or 'z')
                    when plotting a 2D set.
     ==========  ================================================
import matplotlib as mpl from mpl_toolkits.mplot3d import Axes3D import numpy as np import matplotlib.pyplot as plt #ddf mpl.rcParams['legend.fontsize'] = 10 # 设置图示的字体大小; fig = plt.figure() ax = fig.gca(projection='3d') #它表示得到一个3D的axes,#也可以用代码: ax = fig.add_subplot(111, projection='3d') theta = np.linspace(-4 * np.pi, 4 * np.pi, 100) z = np.linspace(0, 4, 100) r = z x = r * np.sin(theta) y = r * np.cos(theta) ax.plot(x, y, z, label='parametric curve') #直接把x, y, z 三者对应的坐标的点传进去了呀 ax.legend() #显示图示; plt.show()
surface plots:
Axes3D.plot_surface(X, Y, Z, *args, **kwargs)Create a surface plot.
By default it will be colored in shades of a solid color, but it also supports color mapping by supplying the cmap argument.
The rstride and cstride kwargs set the stride used to sample the input data to generate the graph. If 1k by 1k arrays are passed in the default values for the strides will result in a 100x100 grid being plotted.
其中一参数:
X, Y, Z    Data values as 2D arrays  #传入的变量;
rstride    Array row stride (step size), defaults to 10  #选择网络中的点的步长,步长越小图越好。
cstride    Array column stride (step size), defaults to 10
color    Color of the surface patches
cmap    A colormap for the surface patches.
facecolors    Face colors for the individual patches
norm    An instance of Normalize to map values to colors
vmin    Minimum value to map
vmax    Maximum value to map
shade    Whether to shade the facecolors
具体参数管什么用哈,我们就看看例子怎么用,我也没有深入研究:
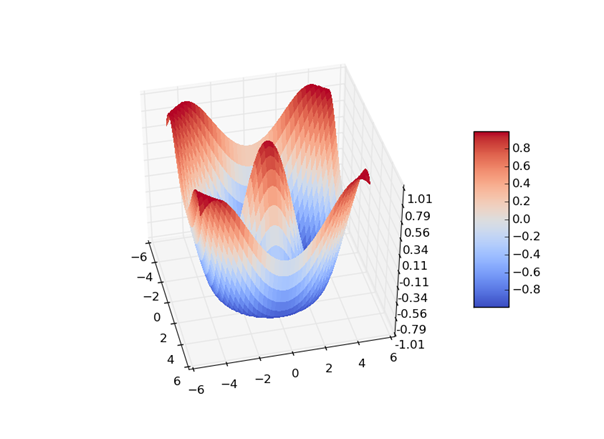
例子1:
aafrom mpl_toolkits.mplot3d import Axes3D
from matplotlib import cm      #里面有很多颜色映射表;
from matplotlib.ticker import LinearLocator, FormatStrFormatter
import matplotlib.pyplot as plt
import numpy as np

fig = plt.figure()
ax = fig.gca(projection='3d')
X = np.arange(-5, 5, 0.25)
Y = np.arange(-5, 5, 0.25)
X, Y = np.meshgrid(X, Y)             #创建X——Y平面表格;
R = np.sqrt(X**2 + Y**2)              #计算每点的高度;
Z = np.cos(R)
surf = ax.plot_surface(X, Y, Z, rstride=1, cstride=1,cmap=cm.coolwarm,
                       linewidth=0, antialiased=False)
ax.set_zlim(-1.01, 1.01)

ax.zaxis.set_major_locator(LinearLocator(10))    #设置z轴的坐标为线性的,且有10个坐标标记啦;
ax.zaxis.set_major_formatter(FormatStrFormatter('%.02f'))     #应该设置了这个z轴坐标的显示格式啦;
fig.colorbar(surf, shrink=.5, aspect=5)           #设置那个颜色带的大小;

plt.show()
输出为:
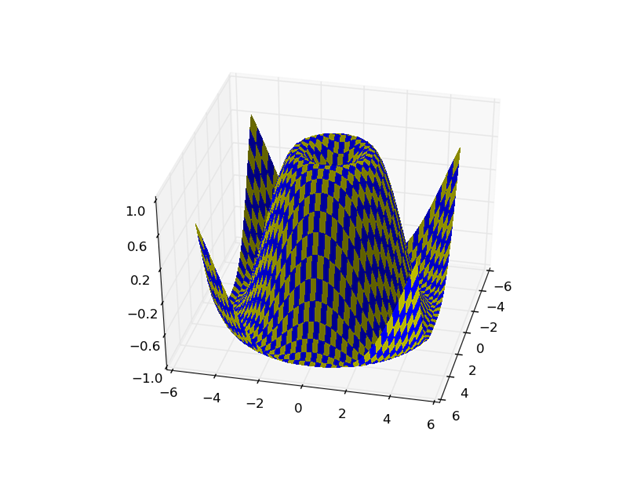
例子2:
from mpl_toolkits.mplot3d import Axes3D
from matplotlib import cm
from matplotlib.ticker import LinearLocator
import matplotlib.pyplot as plt
import numpy as np

fig = plt.figure()
ax = fig.gca(projection='3d')
X = np.arange(-5, 5, 0.25)
xlen = len(X)
Y = np.arange(-5, 5, 0.25)
ylen = len(Y)
X, Y = np.meshgrid(X, Y)
R = np.sqrt(X**2 + Y**2)
Z = np.sin(R)

colortuple = ('y', 'b')
colors = np.empty(X.shape, dtype=str)
for y in range(ylen):
    for x in range(xlen):
        colors[x, y] = colortuple[(x + y) % len(colortuple)]

surf = ax.plot_surface(X, Y, Z, rstride=1, cstride=1, facecolors=colors,
                       linewidth=0, antialiased=False)

ax.set_zlim3d(-1, 1)
ax.w_zaxis.set_major_locator(LinearLocator(6))

plt.show()
输出 :
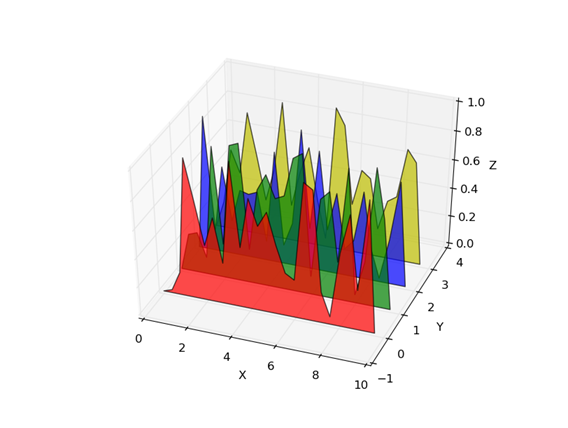
Polygon plots:
Axes3D.add_collection3d(col, zs=0, zdir='z')Add a 3D collection object to the plot.
2D collection types are converted to a 3D version by modifying the object and adding z coordinate information.
- Supported are:
-
- PolyCollection
- LineColleciton
- PatchCollection
- 举个例子:
from mpl_toolkits.mplot3d import Axes3D
from matplotlib.collections import PolyCollection
from matplotlib.colors import colorConverter
import matplotlib.pyplot as plt
import numpy as np


fig = plt.figure()
ax = fig.gca(projection='3d')


def cc(arg):              #它的作用就是改改颜色啦,把颜色的A值 改为0.5,(RGBA是什么看百度,它代表了4个值,然后呢,函数把传入的颜色的lapha值变为0.5)
    return colorConverter.to_rgba(arg, alpha=0.5)

xs = np.arange(0, 10, 0.4)
verts = []
zs = [0.0, 1.0, 2.0, 3.0]
for z in zs:                                          #生成x值、y值对。
    ys = np.random.rand(len(xs))           #产生在0-1之间均匀分布的一定个数的随机数;
    ys[0], ys[-1] = 0, 0
    verts.append(list(zip(xs, ys)))                #函数zip()的作用就是把传放的xs, ys一维数组变为[(xs0, ys0),  (xs1, ys1), (xs1, ys1),   ……]

poly = PolyCollection(verts, facecolors=[cc('r'), cc('g'), cc('b'),
                                         cc('y')])
poly.set_alpha(0.7)                  #设置透明度;
ax.add_collection3d(poly, zs=zs, zdir='y')           #把z轴方向变为y轴方向;

ax.set_xlabel('X')
ax.set_xlim3d(0, 10)
ax.set_ylabel('Y')
ax.set_ylim3d(-1, 4)
ax.set_zlabel('Z')
ax.set_zlim3d(0, 1)

plt.show()
输出:
关于matplotlib里的简单图像的imread()与imshow()函数:
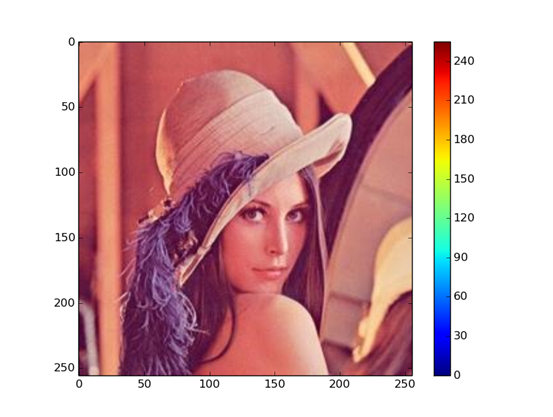
plt.imshow()函数,可以从图像文件读入数据,得到一个表示图像的Numpy数组。它的第一个参数是文件名或文件对象,第二个参数format指定图像类型,如果省略,就由文件的扩展名决定图像的类型。对于灰度图像,它返回一个形状为(M,N)的数组,对于彩色图像,返形状为(M,N,C)的数组。M,N表示图像的高度与宽度,C为3或4,表示图像的通道数。
import matplotlib.pyplot as plt
import numpy as np
img = plt.imread('lena.jpg')

img.shape
#输出为:
(256,256, 3)

img.dtype
#输出为:
dtype('uint8')plt.imshow(img)
plt.colorbar()    # 显示颜色映射表;

plt.show()
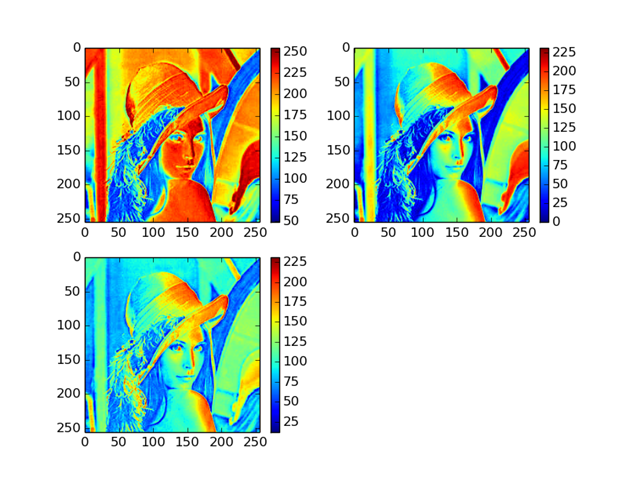
如果在三维数组中的元素类型为浮点类型的话,那么元素的聚会范围为0.0至1.0,与颜色值的0至255对应 。 超出了这个范围,可能出现颜色异常的像素。如果imshow()的参数为二维数组的话,就使用颜色映射表决定每个像素的颜色。默认的颜色映射将最小值映射为蓝色,最大值电映射为红色。
# 接上面的继续来:

fig = plt.figure(1)
ax1 = plt.subplot(221)
ax2 = plt.subplot(222)
ax3 = plt.subplot(223)
plt.sca(ax1)
plt.imshow(img[:,:,0])
#plt.axis('off')
plt.colorbar()
plt.sca(ax2)
plt.imshow(img[:,:,1])
#plt.axis('off')
plt.colorbar()
plt.sca(ax3)
plt.imshow(img[:,:,2])
#plt.axis('off')
plt.colorbar()
plt.show()
通过imshow()的cmap参数可以修改显示图像时所采用的颜色映射表。颜色映射表是一个 ColorMap对象,matplotlib中已经预先定义了很多颜色映射表。可以通过下面的语句得到:
import matplotlib.cm as cm
cm._cmapnames
输出:
['Spectral',
 'copper',
 'RdYlGn',
 'Set2',
 'summer',
 'spring',
 'gist_ncar',
 'terrain',
 'OrRd',
 'RdBu',
 'autumn',
 'gist_earth',
 'Set1',
 'PuBu',
 'Set3',
 'brg',
 'gnuplot2',
 'gist_rainbow',
 'pink',
 'binary',
 'winter',
 'jet',
 'BuPu',
 'Dark2',
 'prism',
 'Oranges',
 'gist_yarg',
 'BuGn',
 'hot',
 'PiYG',
 'YlOrBr',
 'PRGn',
 'Reds',
 'spectral',
 'bwr',
 'RdPu',
 'cubehelix',
 'Greens',
 'rainbow',
 'Accent',
 'gist_heat',
 'YlGnBu',
 'RdYlBu',
 'Paired',
 'flag',
 'hsv',
 'BrBG',
 'seismic',
 'Blues',
 'Purples',
 'cool',
 'Pastel2',
 'gray',
 'coolwarm',
 'Pastel1',
 'gist_stern',
 'gnuplot',
 'GnBu',
 'YlGn',
 'Greys',
 'RdGy',
 'ocean',
 'YlOrRd',
 'PuOr',
 'PuRd',
 'gist_gray',
 'CMRmap',
 'PuBuGn',
 'nipy_spectral',
 'afmhot',
 'bone']




 浙公网安备 33010602011771号