课堂测试第三次(可视化)

1.利用echarts实现可视化,首先是绘制部分

//bar1
        var bar1_myChart = echarts.init(document.querySelector(".bar .chart"));
        var bar1_data=[["河北"],[300]]
        var bar1_option = {
        color: ["#2f89cf"],
        tooltip: {
            trigger: "axis",
            axisPointer: {
                // 坐标轴指示器,坐标轴触发有效
                type: "shadow" // 默认为直线,可选为:'line' | 'shadow'
            }
        },
        grid: {
            left: "0%",
            top: "10px",
            right: "0%",
            bottom: "4%",
            containLabel: true
        },
        xAxis: [{
            type: "category",
            data: bar1_data[0],
            axisTick: {
                alignWithLabel: true
            },
            axisLabel: {
                textStyle: {
                    color: "rgba(255,255,255,.6)",
                    fontSize: "12"
                }
            },
            axisLine: {
                show: false
            }
        }],
        yAxis: [{
            type: "value",
            axisLabel: {
                textStyle: {
                    color: "rgba(255,255,255,.6)",
                    fontSize: "12"
                }
            },
            axisLine: {
                lineStyle: {
                    color: "rgba(255,255,255,.1)"
                        // width: 1,
                        // type: "solid"
                }
            },
            splitLine: {
                lineStyle: {
                    color: "rgba(255,255,255,.1)"
                }
            }
        }],
        series: [{
            name: "销售利润",
            type: "bar",
            barWidth: "80%",
            data: bar1_data[1],
            itemStyle: {
                barBorderRadius: 5
            }
        }]
    };
        bar1_myChart.setOption(bar1_option);
        window.addEventListener("resize", function() {
        bar1_myChart.resize();
    });
//bar1

// line1
        var line1_myChart = echarts.init(document.querySelector(".line .chart"));
        var line1_data = {
        year: [
            [24, 40, 101, 134, 90, 230, 210, 230, 120, 230, 210, 120],
            [40, 64, 191, 324, 290, 330, 310, 213, 180, 200, 180, 79]
        ]
    };
        var line1_option = {
        color: ["#00f2f1", "#ed3f35"],
        tooltip: {
            // 通过坐标轴来触发
            trigger: "axis"
        },
        legend: {
            // 距离容器10%
            right: "10%",
            // 修饰图例文字的颜色
            textStyle: {
                color: "#4c9bfd"
            }
            // 如果series 里面设置了name,此时图例组件的data可以省略
            // data: ["邮件营销", "联盟广告"]
        },
        grid: {
            top: "20%",
            left: "3%",
            right: "4%",
            bottom: "3%",
            show: true,
            borderColor: "#012f4a",
            containLabel: true
        },

        xAxis: {
            type: "category",
            boundaryGap: false,
            data: [
                "1月",
                "2月",
                "3月",
                "4月",
                "5月",
                "6月",
                "7月",
                "8月",
                "9月",
                "10月",
                "11月",
                "12月"
            ],
            // 去除刻度
            axisTick: {
                show: false
            },
            // 修饰刻度标签的颜色
            axisLabel: {
                color: "rgba(255,255,255,.7)"
            },
            // 去除x坐标轴的颜色
            axisLine: {
                show: false
            }
        },
        yAxis: {
            type: "value",
            // 去除刻度
            axisTick: {
                show: true
            },
            // 修饰刻度标签的颜色
            axisLabel: {
                color: "rgba(255,255,255,.7)"
            },
            // 修改y轴分割线的颜色
            splitLine: {
                lineStyle: {
                    color: "#012f4a"
                }
            }
        },
        series: [{
                name: "销售数量",
                type: "line",
                stack: "",
                smooth: true,
                data: line1_data.year[1]
            },
            {
                name: "销售金额",
                type: "line",
                stack: "",
                // 是否让线条圆滑显示
                smooth: true,
                data: line1_data.year[0]
            }
        ]
    };
        line1_myChart.setOption(line1_option);
        window.addEventListener("resize", function() {
        line1_myChart.resize();
    });
//line1


//line2
        var line2_myChart = echarts.init(document.querySelector(".line1 .chart"));
        line2_option = {
        tooltip: {
            trigger: "axis",
            axisPointer: {
                lineStyle: {
                    color: "#dddc6b"
                }
            }
        },
        legend: {
            top: "0%",
            textStyle: {
                color: "rgba(255,255,255,.5)",
                fontSize: "12"
            }
        },
        grid: {
            left: "10",
            top: "30",
            right: "10",
            bottom: "10",
            containLabel: true
        },
        xAxis: [{
                type: "category",
                boundaryGap: false,
                axisLabel: {
                    textStyle: {
                        color: "rgba(255,255,255,.6)",
                        fontSize: 12
                    }
                },
                axisLine: {
                    lineStyle: {
                        color: "rgba(255,255,255,.2)"
                    }
                },

                data: [
                    "01",
                    "02",
                    "03",
                    "04",
                    "05",
                    "06",
                    "07",
                    "08",
                    "09",
                    "11",
                    "12",
                    "13",
                    "14",
                    "15",
                    "16",
                    "17",
                    "18",
                    "19",
                    "20",
                    "21",
                    "22",
                    "23",
                    "24",
                    "25",
                    "26",
                    "27",
                    "28",
                    "29",
                    "30"
                ]
            },
            {
                axisPointer: { show: false },
                axisLine: { show: false },
                position: "bottom",
                offset: 20
            }
        ],
        yAxis: [{
            type: "value",
            axisTick: { show: false },
            axisLine: {
                lineStyle: {
                    color: "rgba(255,255,255,.1)"
                }
            },
            axisLabel: {
                textStyle: {
                    color: "rgba(255,255,255,.6)",
                    fontSize: 12
                }
            },

            splitLine: {
                lineStyle: {
                    color: "rgba(255,255,255,.1)"
                }
            }
        }],
        series: [{
                name: "销售数量",
                type: "line",
                smooth: true,
                symbol: "circle",
                symbolSize: 5,
                showSymbol: false,
                lineStyle: {
                    normal: {
                        color: "#0184d5",
                        width: 2
                    }
                },
                areaStyle: {
                    normal: {
                        color: new echarts.graphic.LinearGradient(
                            0,
                            0,
                            0,
                            1, [{
                                    offset: 0,
                                    color: "rgba(1, 132, 213, 0.4)"
                                },
                                {
                                    offset: 0.8,
                                    color: "rgba(1, 132, 213, 0.1)"
                                }
                            ],
                            false
                        ),
                        shadowColor: "rgba(0, 0, 0, 0.1)"
                    }
                },
                itemStyle: {
                    normal: {
                        color: "#0184d5",
                        borderColor: "rgba(221, 220, 107, .1)",
                        borderWidth: 12
                    }
                },
                data: [
                    300,
                    400,
                    3000,
                    4000,
                    7000,
                    8000,
                    9000,
                    10000,
                    12000,
                    13400,
                    14000,
                    14500,
                    15300,
                    15600,
                    15800,
                    16040,
                    16630,
                    17040,
                    17300,
                    17900,
                    18000,
                    18500,
                    18700,
                    19000,
                    19500,
                    19600,
                    20000,
                    20300,
                    21000,
                    21500
                ]
            },
            {
                name: "销售金额",
                type: "line",
                smooth: true,
                symbol: "circle",
                symbolSize: 5,
                showSymbol: false,
                lineStyle: {
                    normal: {
                        color: "#00d887",
                        width: 2
                    }
                },
                areaStyle: {
                    normal: {
                        color: new echarts.graphic.LinearGradient(
                            0,
                            0,
                            0,
                            1, [{
                                    offset: 0,
                                    color: "rgba(0, 216, 135, 0.4)"
                                },
                                {
                                    offset: 0.8,
                                    color: "rgba(0, 216, 135, 0.1)"
                                }
                            ],
                            false
                        ),
                        shadowColor: "rgba(0, 0, 0, 0.1)"
                    }
                },
                itemStyle: {
                    normal: {
                        color: "#00d887",
                        borderColor: "rgba(221, 220, 107, .1)",
                        borderWidth: 12
                    }
                },
                data: [
                    0,
                    0,
                    0,
                    1,
                    2,
                    3,
                    4,
                    4,
                    5,
                    5,
                    5,
                    10,
                    20,
                    30,
                    50,
                    40,
                    100,
                    120,
                    123,
                    140,
                    150,
                    160,
                    170,
                    180,
                    190,
                    200,
                    210,
                    220,
                    230,
                    240,
                    250
                ]
            }
        ]
    };
        line2_myChart.setOption(line2_option);
        window.addEventListener("resize", function() {
        lin2_myChart.resize();
    });
//line2

//bing2
        var bing2_myChart = echarts.init(document.querySelector(".pie1  .chart"));
        var bing2_option = {
        legend: {
            top: "90%",
            itemWidth: 10,
            itemHeight: 10,
            textStyle: {
                color: "rgba(255,255,255,.5)",
                fontSize: "12"
            }
        },
        tooltip: {
            trigger: "item",
            formatter: "{a} <br/>{b} : {c} ({d}%)"
        },
        // 注意颜色写的位置
        color: [
            "#FF6EB4",
            "#ff9f7f",
            "#9fe6b8",
            "#32c5e9",
            "#FFF68F"
        ],
        series: [{
            name: "活跃度",
            type: "pie",
            // 如果radius是百分比则必须加引号
            radius: ["10%", "70%"],
            center: ["50%", "42%"],
            roseType: "radius",
            data: [
                { value: 26, name: "北京" },
                { value: 24, name: "山东" },
                { value: 25, name: "河北" },
                { value: 20, name: "江苏" },
                { value: 25, name: "浙江" }
            ],
            // 修饰饼形图文字相关的样式 label对象
            label: {
                fontSize: 10
            },
            // 修饰引导线样式
            labelLine: {
                // 连接到图形的线长度
                length: 10,
                // 连接到文字的线长度
                length2: 10
            }
        }]
    };
        bing2_myChart.setOption(bing2_option);
        window.addEventListener("resize", function() {
        bing2_myChart.resize();
    });
//bing2

2.ajax请求数据

        function get_b1_data() {
            $.ajax({
                url: "/b1_hive",
                success: function (data) {
                    bar1_option.xAxis[0].data=data.name;
                    bar1_option.series[0].data=data.value;
                    bar1_myChart.setOption(bar1_option);
                },
                error: function (xhr, type, errorThrown) {
                }
            })
        }
        function get_l2_data() {
            $.ajax({
                url: "/l2_hive",
                success: function (data) {
                    line1_option.xAxis.data=data.day;
                    line1_option.series[0].data = data.heal_add;
                    line1_option.series[1].data=data.dead_add;
                    line1_myChart.setOption(line1_option);
                },
                error: function (xhr, type, errorThrown) {
                }
            })
        }
        function get_r2_data() {
            $.ajax({
                url: "/r2_hive",
                success: function (data) {
                    //bing1_option.legend.data=data.name;
                    bing2_option.series[0].data=data.data;
                    bing2_myChart.setOption(bing2_option);
                },
                error: function (xhr, type, errorThrown) {
                }
            })
        }
        function get_l1_data() {
            $.ajax({
                url: "/l1_hive",
                success: function (data) {
                    line2_option.xAxis[0].data=data.day;
                    line2_option.series[0].data = data.confirm;
                    line2_option.series[1].data=data.dead;
                    line2_myChart.setOption(line2_option);
                },
                error: function (xhr, type, errorThrown) {
                }
            })
        }
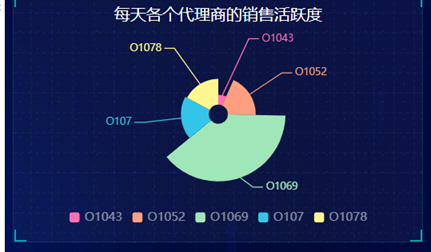
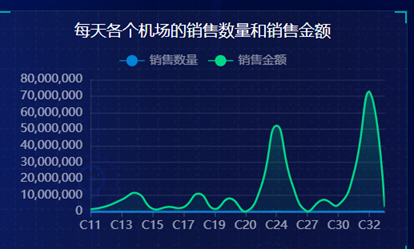
3.效果展示


posted @ 2021-10-04 22:10  风吹过半夏  阅读(51)  评论(0编辑  收藏  举报