
Jquery画折线图、柱状图、饼图
1.今天做了一个折线图,首先需要导js文件。这里有一个demo:https://files.cnblogs.com/files/feifeishi/jquery_zhexiantubingtuzhuzhuangtu_demo.rar,里边有要用到的js文件。
我的折线图用这两个文件。这里不能用jquery.js,没有因为,没有所以,那样会出错,主线不会显示。

2.代码
<div style="margin: 0 2em">
<div id="container" style="min-width: 400px; height: 400px; margin: 0 auto"></div>
</div>
<script type="text/javascript">
$(document).ready(function() {
var xx = [];
var yy = [];
for (var i = 1; i <$('#table tr').length; i++) {
xx.push(parseFloat($('#table tr').eq(i).children("td").eq(0).text().trim()));
yy.push(parseFloat($('#table tr').eq(i).children("td").eq(2).text()));
}
console.log(xx);console.log(yy);
var chart;
chart = new Highcharts.Chart({
chart: {
renderTo: 'container',
type: 'line',
marginRight: 220,
marginBottom: 25
},
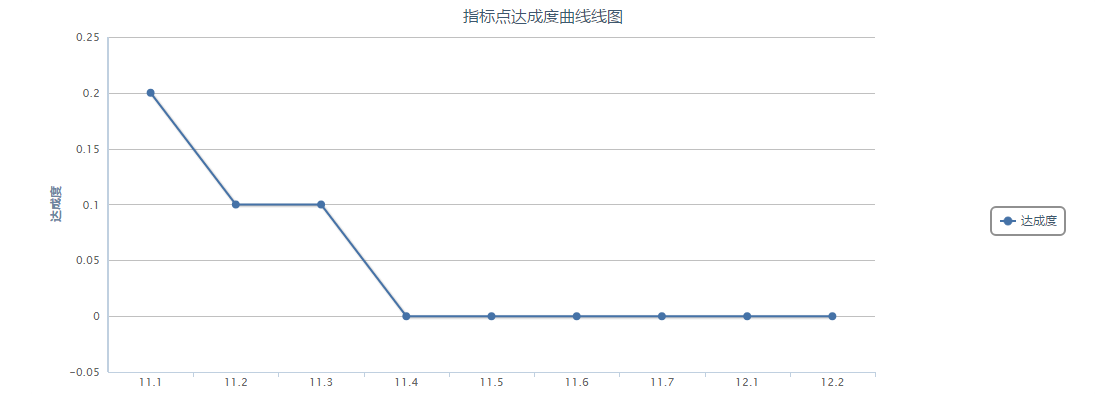
title: {
text: '指标点达成度曲线线图',
x: -20 //center
},
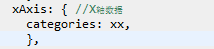
xAxis: { //X轴数据
categories: xx,
},
yAxis: { //Y轴显示文字
lineWidth: 2,
title: {
text: '达成度'
}
},
tooltip: {
formatter: function() {
return '<b>' + this.x + '</b><br/>' + this.series.name + ': ' + Highcharts.numberFormat(this.y, 0);
}
},
plotOptions: {
column: {
dataLabels: {
enabled: true
},
enableMouseTracking: true //是否显示title
}
},
legend: {
layout: 'vertical',
align: 'right',
verticalAlign: 'top',
x: -20,
y: 200,
borderWidth: 2
},
series: [{
name: '达成度',
data: yy
}]
});
});
</script>
3.结果截图
4.个人理解
首先jquery很强大,代码封装的功能很全,调用十分简单。然后这个里边主要就是两个数组x[]和y[],将数据放到里边然后调用就可以了。

5.柱状图,需要在导一个js文件
<script src="js/exporting.js" type="text/javascript"></script>
代码:
$(document).ready(function() {
var xx = [];
var yy = [];
for (var i = 1; i <$('#table tr').length; i++) {
xx.push(parseFloat($('#table tr').eq(i).children("td").eq(0).text().trim()));
yy.push(parseFloat($('#table tr').eq(i).children("td").eq(2).text()));
}
var chart;
chart = new Highcharts.Chart({
chart: {
renderTo: 'containerliuliang',
//放置图表的容器
plotBackgroundColor: null,
plotBorderWidth: null,
defaultSeriesType: 'column' //图表类型line, spline, area, areaspline, column, bar, pie , scatter
},
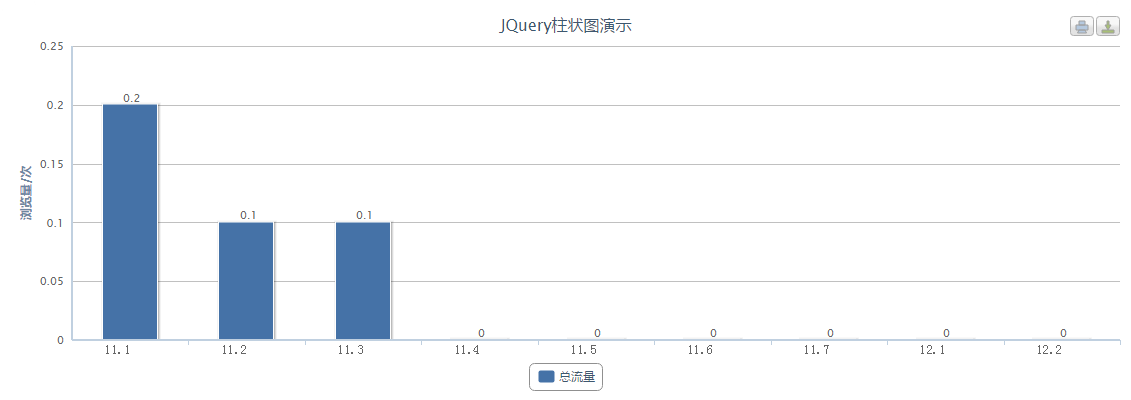
title: {
text: 'JQuery柱状图演示'
},
xAxis: { //X轴数据
categories: xx,
lineWidth: 2,
labels: {
align: 'right',
style: {
font: 'normal 13px 宋体'
}
}
},
yAxis: { //Y轴显示文字
lineWidth: 2,
title: {
text: '浏览量/次'
}
},
tooltip: {
formatter: function() {
return '<b>' + this.x + '</b><br/>' + this.series.name + ': ' + Highcharts.numberFormat(this.y, 0);
}
},
plotOptions: {
column: {
dataLabels: {
enabled: true
},
enableMouseTracking: true //是否显示title
}
},
series: [{
name: '总流量',
data: yy
}]
});
//$("tspan:last").hide(); //把广告删除掉
});
结果截图
6.饼图
代码:
(function($) { // encapsulate jQuery
$(document).ready(function() {
var xx = [];
var yy = [];
for (var i = 1; i <$('#table tr').length; i++) {
xx.push(parseFloat($('#table tr').eq(i).children("td").eq(0).text().trim()));
yy.push(parseFloat($('#table tr').eq(i).children("td").eq(2).text()));
}
var chart;
chart = new Highcharts.Chart({
chart: {
renderTo: 'container',
plotBackgroundColor: null,
plotBorderWidth: null,
plotShadow: false
},
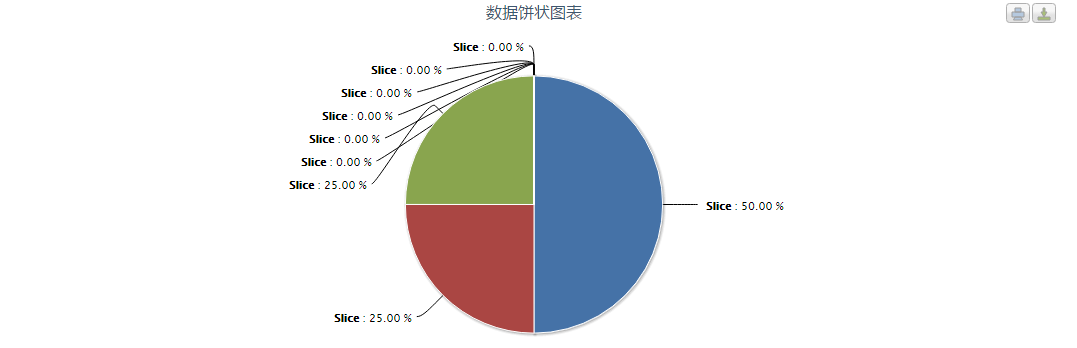
title: {
text: '数据饼状图表'
},
tooltip: {
formatter: function() {
return '<b>' + this.point.name + '</b>: ' + this.percentage.toFixed(2) + ' %';
}
},
plotOptions: {
pie: {
allowPointSelect: true,
cursor: 'pointer',
dataLabels: {
enabled: true,
color: '#000000',
connectorColor: '#000000',
formatter: function() {
return '<b>' + this.point.name + '</b>: ' + this.percentage.toFixed(2) + ' %';
}
}
}
},
series: [{
type: 'pie',
name: 'pie',
data: yy
}]
});
});
})(jQuery);
结果截图

 浙公网安备 33010602011771号