解读svg points坐标值
<svg xmlns="http://www.w3.org/2000/svg" version="1.1">
  <polygon points="100,10 40,180 190,60 10,60 160,180"
  style="fill:lime;stroke:purple;stroke-width:5;fill-rule:nonzero;" />
</svg>
最近对svg的基础知识梳理了一下,发现points里坐标值不是很理解,如下:
100,10 40,180 190,60 10,60 160,180
刚看到这个坐标值时,思维被禁锢了,100以为是x y 坐标值一样,所以省略了一个,但是浏览器里呈现的图像完全不是这个意思啊:

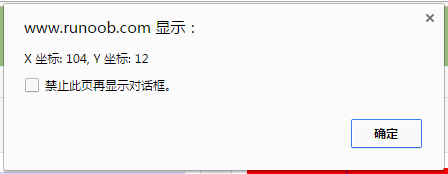
百思不得其解,干脆用js获取坐标值来理解好了,写了下面的代码:
<!DOCTYPE html>
<html>
	<style>
		*{
			margin:0;
			padding:0;
		}
		svg{
			background:red;
			width:300px;
			height:300px;
		}
	</style>
<script type="text/javascript">
	function zuobiao(event){
	  xzb=event.clientX
	  yzb=event.clientY
	  alert("X 坐标: " + xzb + ", Y 坐标: " + yzb)
	}
</script>

<body  OnMouseDown="zuobiao(event)">

<svg xmlns="http://www.w3.org/2000/svg" version="1.1">
  <polygon points="100,10 40,180 190,60 10,60 160,180" style="fill:lime;stroke:purple;stroke-width:5;fill-rule:nonzero;"/>
</svg>

</body>
</html>
结论:points=" x1坐标,y1坐标 x2坐标,y2坐标 x3坐标,y3坐标 "

 浙公网安备 33010602011771号