Python爬虫——定向爬取“中国大学排名网”(二)
针对上篇博客中数据写入csv环节,利用pandas进行优化,并增添数据统计的功能
 1 import bs4
 2 import requests
 3 from bs4 import BeautifulSoup
 4 import pandas as pd
 5 import matplotlib.pyplot as plt
 6
 7 def getHTMLText(url):
 8     try:
 9         res = requests.get(url,timeout = 30)
10         res.raise_for_status()
11         res.encoding = res.apparent_encoding
12         return res.text
13     except:
14         return "访问未成功"
15
16
17 def fillUnivList(ulist, html):  # 将一个html页面放入一个列表
18     soup = BeautifulSoup(html, "html.parser")
19     # 每个<tr>包含一所大学的所有信息
20     # 所有<tr>信息包在<tbody>中
21     for tr in soup.find('tbody').children:
22         if isinstance(tr, bs4.element.Tag):  # 过滤掉非标签信息,以取出包含在<tr>标签中的bs4类型的Tag标签
23             tds = tr('td')  # 等价于tr.find_all('td'),在tr标签中找td标签内容
24             # print(tds)
25             ulist.append([tds[0].string, tds[1].string, tds[3].string, tds[2].string])
26             # td[0],[1],[3],[2],分别对应每组td信息中的排名,学校名称,得分,区域。将这些信息从摘取出来
27             print(ulist)
28     return ulist
29
30 def writedata(ulist,file):
31     where_list = []
32     dict = {}
33     df = pd.DataFrame(ulist,columns=['排名','学校名称','得分','区域'])  #list转dataframe
34     df.to_csv(file,',',index=False,encoding="gbk")
35     print("写入完成!")
36     for i in range(100):
37         if df.iloc[i,-1] in where_list:
38             dict[df.iloc[i,-1]] += 1
39         else:
40             where_list.append(df.iloc[i,-1])
41             dict[df.iloc[i,-1]] = 1
42     print(dict)
43
44     return dict
45
46 def draw_pictures(dict):
47     provinces = list(dict.keys())
48     num = list(dict.values())
49
50     plt.figure()
51     rects1 = plt.bar(provinces,num,width=0.5,color="#DAA520")
52     #x轴刻度
53     plt.xticks(range(len(provinces)), provinces, rotation=90, fontproperties='SimHei', fontsize=8)
54     #高度标记
55     for rect in rects1:
56         height = rect.get_height()
57         plt.text(rect.get_x() + rect.get_width() / 2, height, height, ha="center", va="bottom", fontsize=7)
58
59     #坐标轴范围
60     plt.xlim(-1, len(provinces) + 1)
61     plt.ylim(0, max(num) +3)
62     # 坐标轴标注
63     plt.ylabel("数量", fontproperties='SimHei', fontsize=10)
64     # 标题
65     plt.title('各省市Top100大学分布数量', fontproperties='SimHei', fontsize=12)
66     plt.show()
67
68
69 if __name__ == '__main__':
70     uinfo = []
71     url = "http://www.zuihaodaxue.cn/zuihaodaxuepaiming2019.html"
72     soup = getHTMLText(url)
73     ulist = fillUnivList(uinfo,soup)
74     file = "D:\\tt.csv"
75     dict = writedata(ulist,file)
76     draw_pictures(dict)
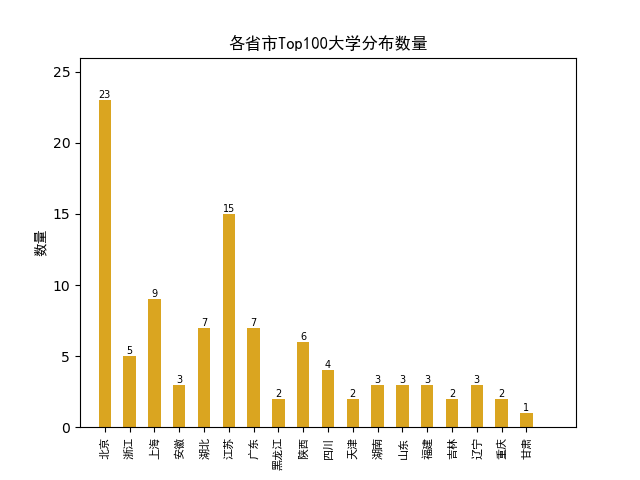
统计的条形图如下

 浙公网安备 33010602011771号