windows下ELK8.0搭建
第一步:官网下载相关文件
https://www.elastic.co/cn/elastic-stack/
第二步:启动起来,如果要在ELK上显现日志,LogStash需要在bin目录下新建一个conf文件做配置
input {
  udp{
        host=>"你的IP"
        port=>9601
    }
    file {
   path => "C:/Users/Administrator/source/repos/Test/APITest/bin/Debug/netcoreapp3.1/Logs/\*.log"
    }
}
output {
  elasticsearch {
    hosts => ["http://localhost:9200/"]
    index => "logstash-%{+YYYY.MM.dd}"
  }
}
然后将使用一下命令启动logstash
logstash.bat -f   logstash_default.conf
如果报错,可以使用绝对路径
启动之后
ES:http://localhost:9200
Kibana:http://localhost:5601
第三步:VS新建一个项目,我用的是Nlog
Nlog配置如下:
<?xml version="1.0" encoding="utf-8" ?>
<nlog xmlns="http://www.nlog-project.org/schemas/NLog.xsd"
      xmlns:xsi="http://www.w3.org/2001/XMLSchema-instance"
      xsi:schemaLocation="http://www.nlog-project.org/schemas/NLog.xsd NLog.xsd"
      autoReload="true"
      throwExceptions="false"
      internalLogLevel="Off" internalLogFile="c:\temp\nlog-internal.log">

  <!-- optional, add some variables
  https://github.com/nlog/NLog/wiki/Configuration-file#variables
  -->
  <variable name="myvar" value="myvalue"/>

  <!--
  See https://github.com/nlog/nlog/wiki/Configuration-file
  for information on customizing logging rules and outputs.
   -->
  <targets>

    <!--
    add your targets here
    See https://github.com/nlog/NLog/wiki/Targets for possible targets.
    See https://github.com/nlog/NLog/wiki/Layout-Renderers for the possible layout renderers.
    -->

    <!--
    Write events to a file with the date in the filename.
    <target xsi:type="File" name="f" fileName="${basedir}/logs/${shortdate}.log"
            layout="${longdate} ${uppercase:${level}} ${message}" />
    -->
    <!--Error保存至文件-->
    <target name="error_file" xsi:type="File" maxArchiveFiles="30"  encoding="utf-8"
            fileName="${basedir}/Logs/${date:yyyyMMdd}_Error.log"
            archiveFileName="${basedir}/Logs/${date:yyyyMMdd}_Error.{#}.log"
            archiveDateFormat="yyyyMMdd"
            archiveAboveSize="104857600"
            archiveNumbering="Sequence"
            layout="${date:yyyy-MM-dd HH\:mm\:ss} ${message} ${onexception:${exception:format=tostring} ${newline} ${stacktrace}" />
    <!--Trace保存至文件-->
    <target name="trace_file" xsi:type="File" maxArchiveFiles="30" encoding="utf-8"
            fileName="${basedir}/Logs/${date:yyyyMMdd}_Trace.log"
            archiveFileName="${basedir}/Logs/${date:yyyyMMdd}_Trace.{#}.log"
            archiveDateFormat="yyyyMMdd"
            archiveAboveSize="104857600"
            archiveNumbering="Sequence"
            layout="${date:yyyy-MM-dd HH\:mm\:ss} ${uppercase:${level}}: ${message}" />
    <!--<target xsi:type="Network"
    name="ownLog-tcp"
    keepConnection="false"
    address ="tcp://你的IP:9601/"
    layout="${longdate} ${logger} ${uppercase:${level}}
${newline}【请求url】:${aspnet-request-url}
${newline}【输出信息】:${message},【堆栈信息】:${exception: Type, ToString, Method, StackTrace}
${newline}"></target>-->
    <target name="network" xsi:type="Network" address="udp://你的IP:9601" layout="${message}"/>
  </targets>


  <rules>
    <!-- add your logging rules here -->
    <logger name="*" minlevel="Trace"  writeTo="trace_file" />
    <!--<logger name="*" minlevel="Debug" writeTo="debugger" />-->
    <logger name="*" minlevel="Error" writeTo="error_file" />
    <!--<logger name="*" minlevel="Info" writeTo="ownLog-tcp" />-->
    <logger name="*" minlevel="Trace" writeTo="network" />
    <!--
    Write all events with minimal level of Debug (So Debug, Info, Warn, Error and Fatal, but not Trace)  to "f"
    <logger name="*" minlevel="Debug" writeTo="f" />
    -->
  </rules>
</nlog>
之后你可以自己写点日志。
第四步:进入kibana查看

8.0之后 Kibana的 Index patterns 被移动到了 data views里面

那我们就在data views去看看
这样就创建好了

然后就可以查看日志了,可以看看效果
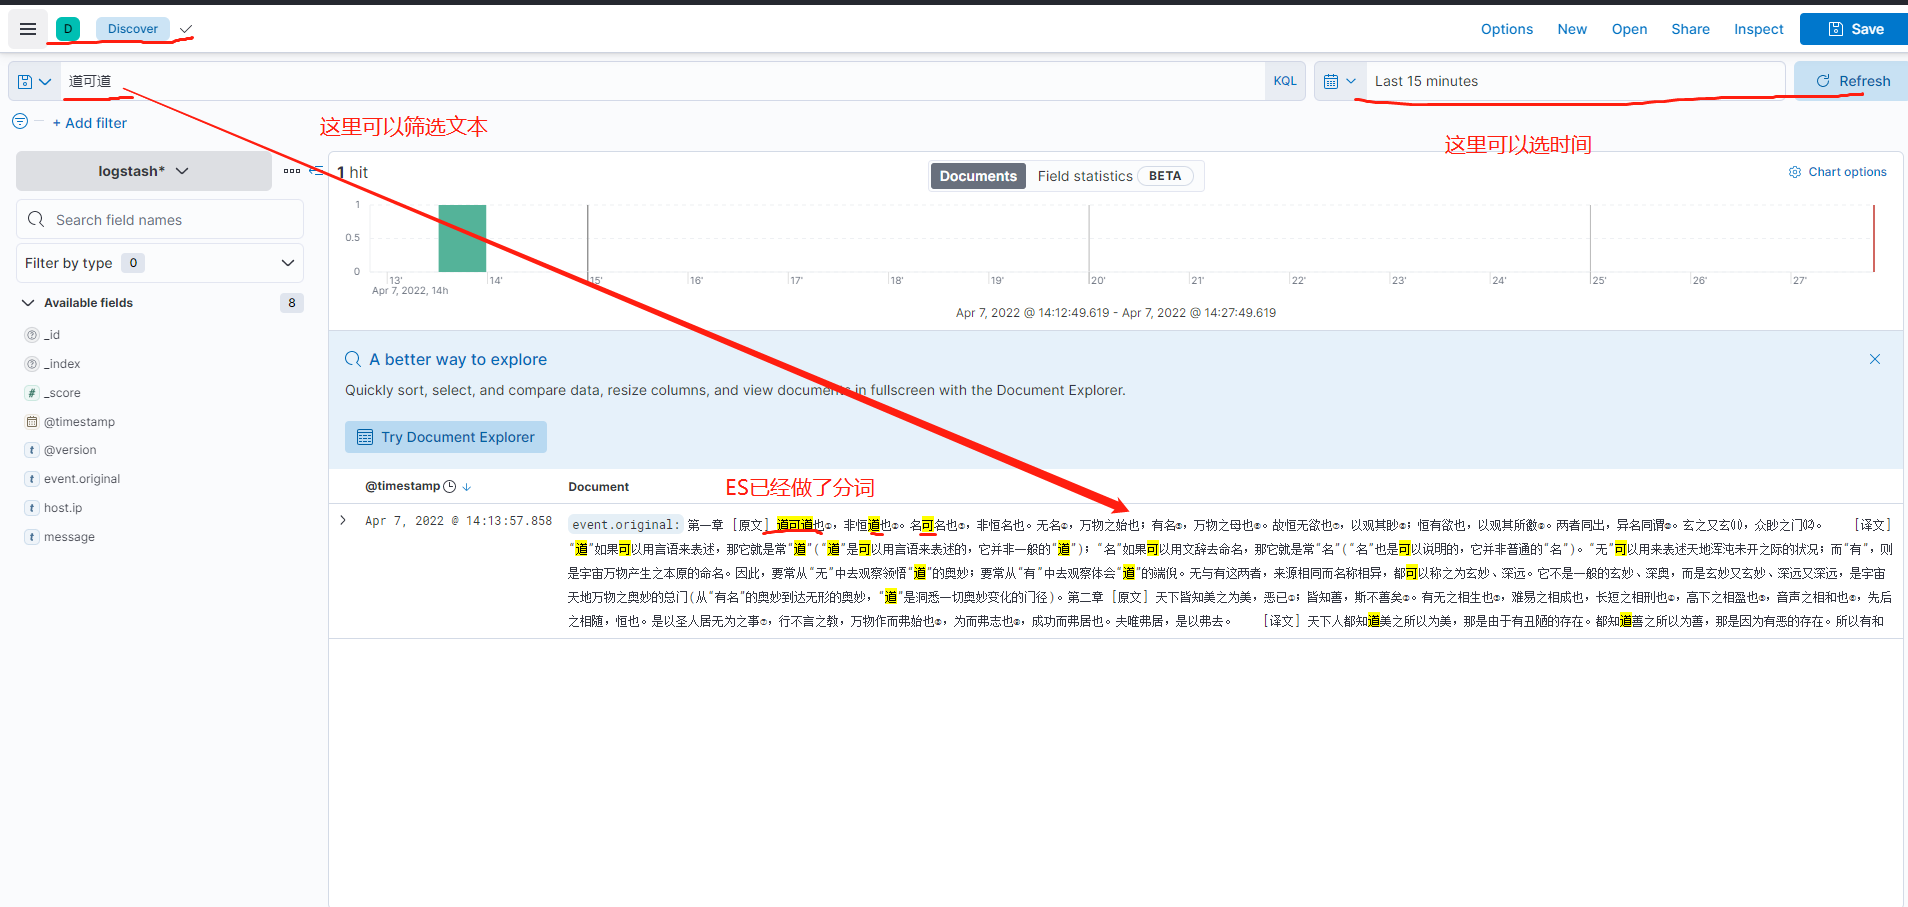
如果需要更加准确的中文分词,可以下载相关插件IK分词之类的,然后将插件拷贝到ES的plugin下面,重启ES即可
我也只是简单的搭建然后实践了一下,更高级的用法还没用过,后续有机会研究一下。

 浙公网安备 33010602011771号