e-chart实现label文字渐变色
产品需要把 e-chart 折线图上的label文字颜色调整为面积图一致颜色,试了几个方法都没有解决,最后通过svg解决了,记录一下
解决思路:把e-chart 使用svg渲染,然后定义label时使用富文本,color使用单独定义的svg渐变颜色
实现效果如下:
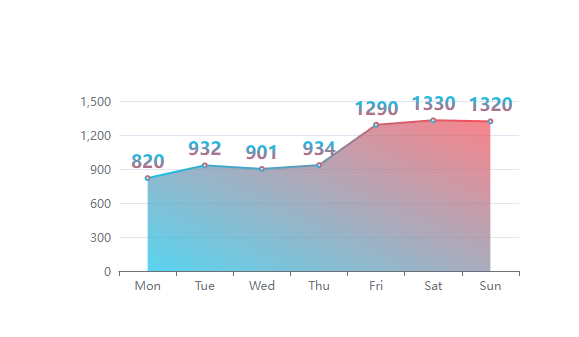
主要代码如下,
// svg渐变色
<svg>
    <linearGradient id="textGradient" x1="0" y1="0" x2="0" y2="1">
      <stop offset="20%" stop-color="#12c2e9"></stop>
      <stop offset="100%" stop-color="#f64f59"></stop>
    </linearGradient>
  </svg>
// e-chart 使用svg渲染方式
 var chartDom = document.getElementById('main');
 var myChart = echarts.init(chartDom, '', { renderer: 'svg' });
1 2 3 4 5 6 7 8 9 10 11 12 13 14 15 16 17 18 19 | // lable 使用富文本 label: { show: true, position: 'top', formatter(a, b) { return `{span|${a.data || 0}}{legend|}`; }, color: 'url(#textGradient)',//渐变色 rich: { span: { fontSize: 18, fontWeight: 'bold' }, legend: { fontSize: 14 } } }, |
完整代码如下

<template>
  <div style="width: 500px; height: 300px" id="main"></div>
  <svg>
    <linearGradient id="textGradient" x1="0" y1="0" x2="0" y2="1">
      <stop offset="20%" stop-color="#12c2e9"></stop>
      <stop offset="100%" stop-color="#f64f59"></stop>
    </linearGradient>
  </svg>

</template>
<script setup lang="ts">
import * as echarts from 'echarts';
import { onMounted, nextTick } from "vue";

onMounted(() => {
  nextTick(() => {
    var chartDom = document.getElementById('main');
    var myChart = echarts.init(chartDom, '', { renderer: 'svg' });
    var option;

    option = {
      tooltip: {
        trigger: 'axis',
        axisPointer: {
          type: 'cross',
          label: {
            backgroundColor: '#6a7985'
          }
        }
      },
      xAxis: [
        {
          type: 'category',
          data: ['Mon', 'Tue', 'Wed', 'Thu', 'Fri', 'Sat', 'Sun']
        }
      ],
      yAxis: [
        {
          type: 'value'
        }
      ],
      series: [
        {
          name: 'Search Engine',
          type: 'line',
          stack: 'Total',
          color:{
            type: 'linear',
            x: 0,
            y: 1,
            colorStops: [
              {
                offset: 0,
                color: '#12c2e9',
              },
              {
                offset: 1,
                color: '#f64f59',
              },
            ],
            global: false // 缺省为 false
          },
          label: {
            show: true,
            position: 'top',
            formatter(a, b) {
              return `{span|${a.data || 0}}{legend|}`;
            },
            color: 'url(#textGradient)',//渐变色
            rich: {
              span: {
                fontSize: 18,
                fontWeight: 'bold'
              },
              legend: {
                fontSize: 14
              }
            }
          },
          areaStyle: {},
          emphasis: {
            focus: 'series'
          },
          data: [820, 932, 901, 934, 1290, 1330, 1320]
        }
      ]
    };
    myChart.setOption(option);
  })
})
</script>
<style scoped>
</style>
标签:
e-chart


【推荐】国内首个AI IDE,深度理解中文开发场景,立即下载体验Trae
【推荐】编程新体验,更懂你的AI,立即体验豆包MarsCode编程助手
【推荐】抖音旗下AI助手豆包,你的智能百科全书,全免费不限次数
【推荐】轻量又高性能的 SSH 工具 IShell:AI 加持,快人一步
· TypeScript + Deepseek 打造卜卦网站:技术与玄学的结合
· 阿里巴巴 QwQ-32B真的超越了 DeepSeek R-1吗?
· 【译】Visual Studio 中新的强大生产力特性
· 【设计模式】告别冗长if-else语句:使用策略模式优化代码结构
· 10年+ .NET Coder 心语 ── 封装的思维:从隐藏、稳定开始理解其本质意义