e-chart实现上下图表使用一个tooltip移入事件
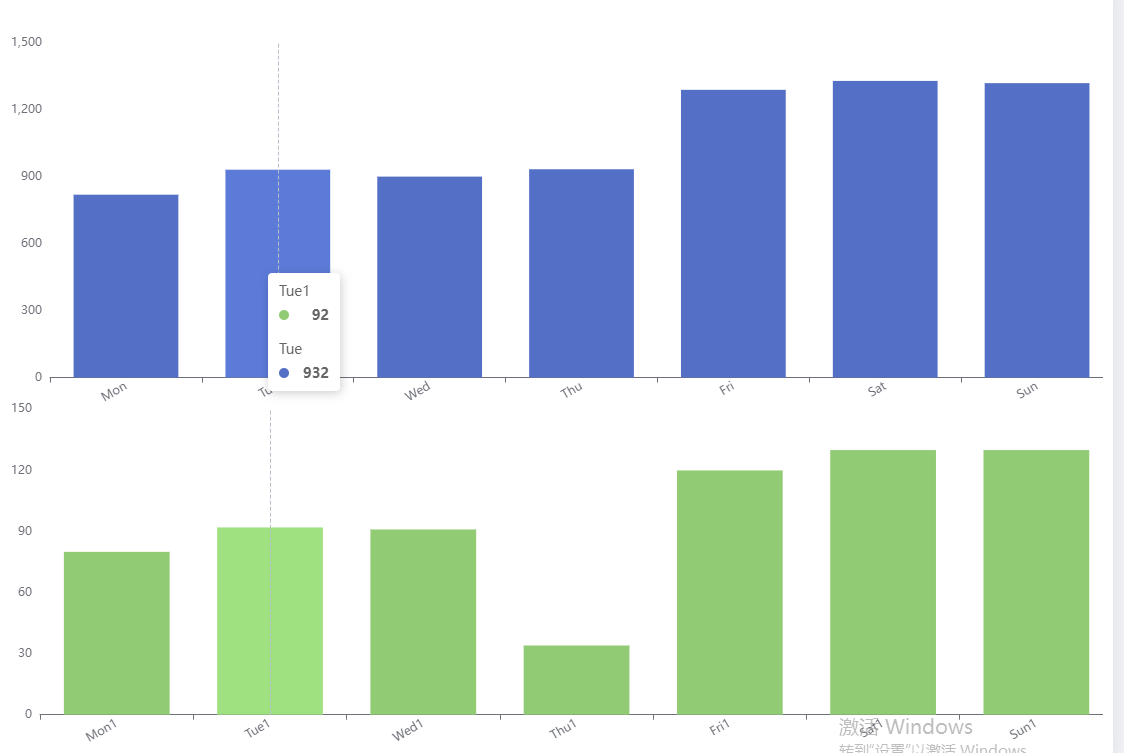
有的需求需要一次移入事件展示多个图标的tooltip方便用户查看,效果如下
效果一:

效果一:
链接如下 : e-chart
主要配置是

 tooltip: {
    trigger: 'axis',
    axisPointer: {
      animation: false
    }
  },
  axisPointer: {
    link: [
      {
        xAxisIndex: 'all'
      }
    ]
  },
完整option代码
option = {
  tooltip: {
    trigger: 'axis',
    axisPointer: {
      animation: false
    }
  },
  axisPointer: {
    link: [
      {
        xAxisIndex: 'all'
      }
    ]
  },
  title: [],
  grid: [
    {
      top: 50,
      width: '100%',
      bottom: '45%',
      left: 10,
      containLabel: true
    },
    {
      top: '55%',
      width: '100%',
      bottom: 0,
      left: 10,
      containLabel: true
    }
  ],
  yAxis: [
    {
      type: 'value',
      splitLine: {
        show: false
      }
    },
    {
      type: 'value',
      gridIndex: 1,
      splitLine: {
        show: false
      }
    }
  ],
  xAxis: [
    {
      type: 'category',
      data: ['Mon', 'Tue', 'Wed', 'Thu', 'Fri', 'Sat', 'Sun'],
      axisLabel: {
        interval: 0,
        rotate: 30
      },
      splitLine: {
        show: false
      }
    },
    {
      gridIndex: 1,
      type: 'category',
      data: ['Mon1', 'Tue1', 'Wed1', 'Thu1', 'Fri1', 'Sat1', 'Sun1'],
      axisLabel: {
        interval: 0,
        rotate: 30
      },
      splitLine: {
        show: false
      }
    }
  ],
  series: [
    {
      type: 'bar',
      stack: 'chart',
      z: 3,
      data: [820, 932, 901, 934, 1290, 1330, 1320]
    },
    {
      type: 'bar',
      stack: 'component',
      xAxisIndex: 1,
      yAxisIndex: 1,
      z: 3,
      data: [80, 92, 91, 34, 120, 130, 130]
    }
  ]
};
效果二:
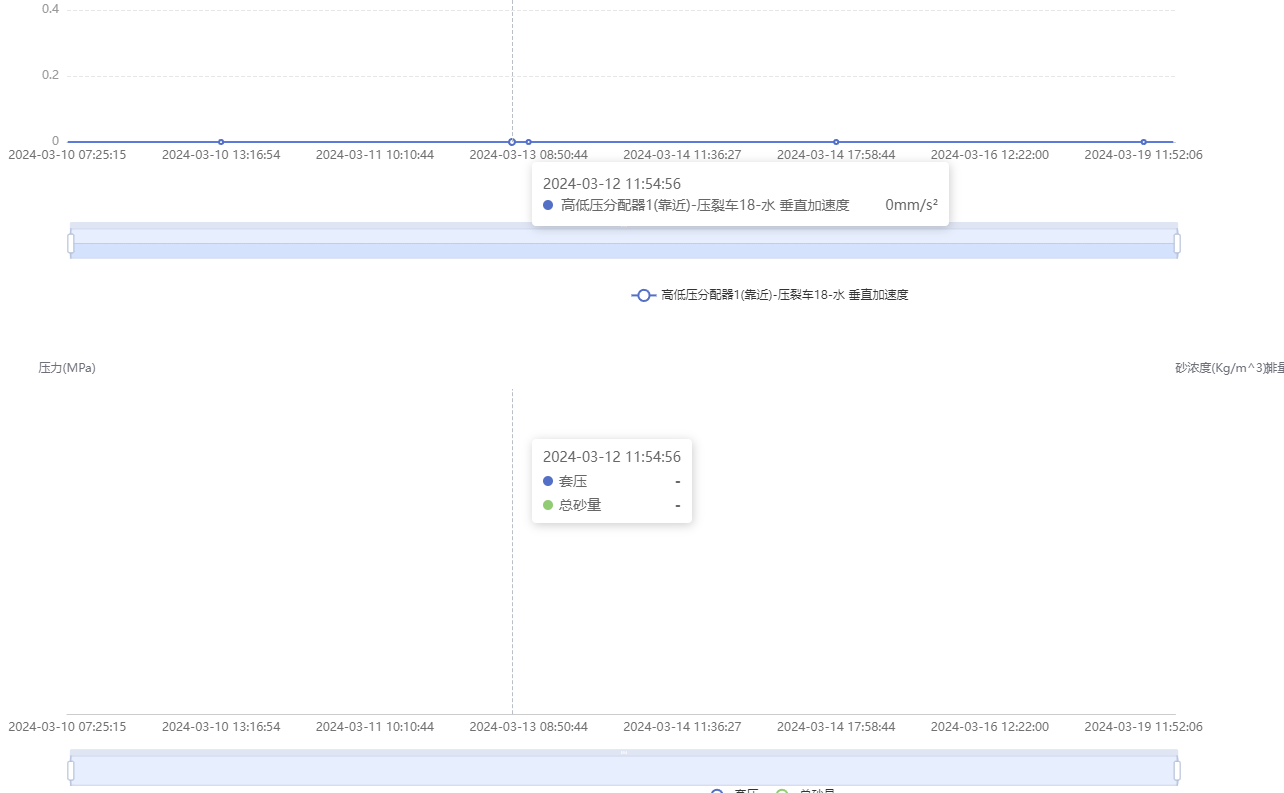
                const myChart1 = this.chart; // 图表1
                const myChart2 = this.TwoExcelChartDom; // 图表2
                myChart1.getZr().on('mousemove', (params) => {
                    const pointInPixel = [params.offsetX, params.offsetY];
                    // 判断当前鼠标移动的位置是否在图表中
                    if (myChart1.containPixel('grid', pointInPixel)) {
                        const pointInGrid = myChart1.convertFromPixel({ seriesIndex: 0 }, pointInPixel);
                        if(pointInGrid){
                            const xIndex = pointInGrid[0];
                            const op = myChart1.getOption();
                            const xDate = op.xAxis[0].data[xIndex];
                            let xAxisArray = myChart2.getOption().xAxis[0].data
                            const dataIndex = xAxisArray.findIndex(x => x === xDate);
                            myChart2.dispatchAction({
                                type: 'showTip',
                                seriesIndex: 0,
                                dataIndex
                            });
                        }
                    }
                })
                myChart2.getZr().on('mousemove', (params) => {
                    const pointInPixel = [params.offsetX, params.offsetY];
                    // 判断当前鼠标移动的位置是否在图表中
                    if (myChart2.containPixel('grid', pointInPixel)) {
                    const pointInGrid = myChart2.convertFromPixel({ seriesIndex: 0 }, pointInPixel);
                        if(pointInGrid){
                            const xIndex = pointInGrid[0];
                            const op = myChart2.getOption();
                            const xDate = op.xAxis[0].data[xIndex];
                            let xAxisArray = myChart1.getOption().xAxis[0].data
                            const dataIndex = xAxisArray.findIndex(x => x === xDate);
                            myChart1.dispatchAction({
                                type: 'showTip',
                                seriesIndex: 0,
                                dataIndex
                            });
                        }
                    }
                })


【推荐】国内首个AI IDE,深度理解中文开发场景,立即下载体验Trae
【推荐】编程新体验,更懂你的AI,立即体验豆包MarsCode编程助手
【推荐】抖音旗下AI助手豆包,你的智能百科全书,全免费不限次数
【推荐】轻量又高性能的 SSH 工具 IShell:AI 加持,快人一步
· Manus爆火,是硬核还是营销?
· 终于写完轮子一部分:tcp代理 了,记录一下
· 别再用vector<bool>了!Google高级工程师:这可能是STL最大的设计失误
· 单元测试从入门到精通
· 震惊!C++程序真的从main开始吗?99%的程序员都答错了