Tensorflow基本图像分类复现
参考资料
基本分类:对服装图像进行分类 | TensorFlow Core (google.cn)
获取数据集
Tensorflow上的FASHION MNINST数据集需要科学地上网才能使用,选择将数据集下载到本地训练。
下载地址:链接:https://pan.baidu.com/s/1LeWo_pGOSo7tIO-hr0Q8aQ 提取码:hfdd
# 获取本地FASHION_MNIST数据
def get_data():
    train_image = r"D:/Fashion-MNIST/train-images-idx3-ubyte.gz"
    test_image = r"D:/Fashion-MNIST/t10k-images-idx3-ubyte.gz"
    train_label = r"D:/Fashion-MNIST/train-labels-idx1-ubyte.gz"
    test_label = r"D:/Fashion-MNIST/t10k-labels-idx1-ubyte.gz" #文件路径
    paths = [train_label, train_image, test_label,test_image]

    with gzip.open(paths[0], 'rb') as lbpath:
        y_train = np.frombuffer(lbpath.read(), np.uint8, offset=8)

    with gzip.open(paths[1], 'rb') as imgpath:
        x_train = np.frombuffer(
            imgpath.read(), np.uint8, offset=16).reshape(len(y_train), 28, 28)

    with gzip.open(paths[2], 'rb') as lbpath:
        y_test = np.frombuffer(lbpath.read(), np.uint8, offset=8)

    with gzip.open(paths[3], 'rb') as imgpath:
        x_test = np.frombuffer(
            imgpath.read(), np.uint8, offset=16).reshape(len(y_test), 28, 28)

    return (x_train, y_train), (x_test, y_test)
获取数据集:
(train_images, train_labels), (test_images, test_labels) = get_data()
数据预处理
train_images = train_images / 255.0 # 将像素值压缩到0到1之间
test_images = test_images / 255.0
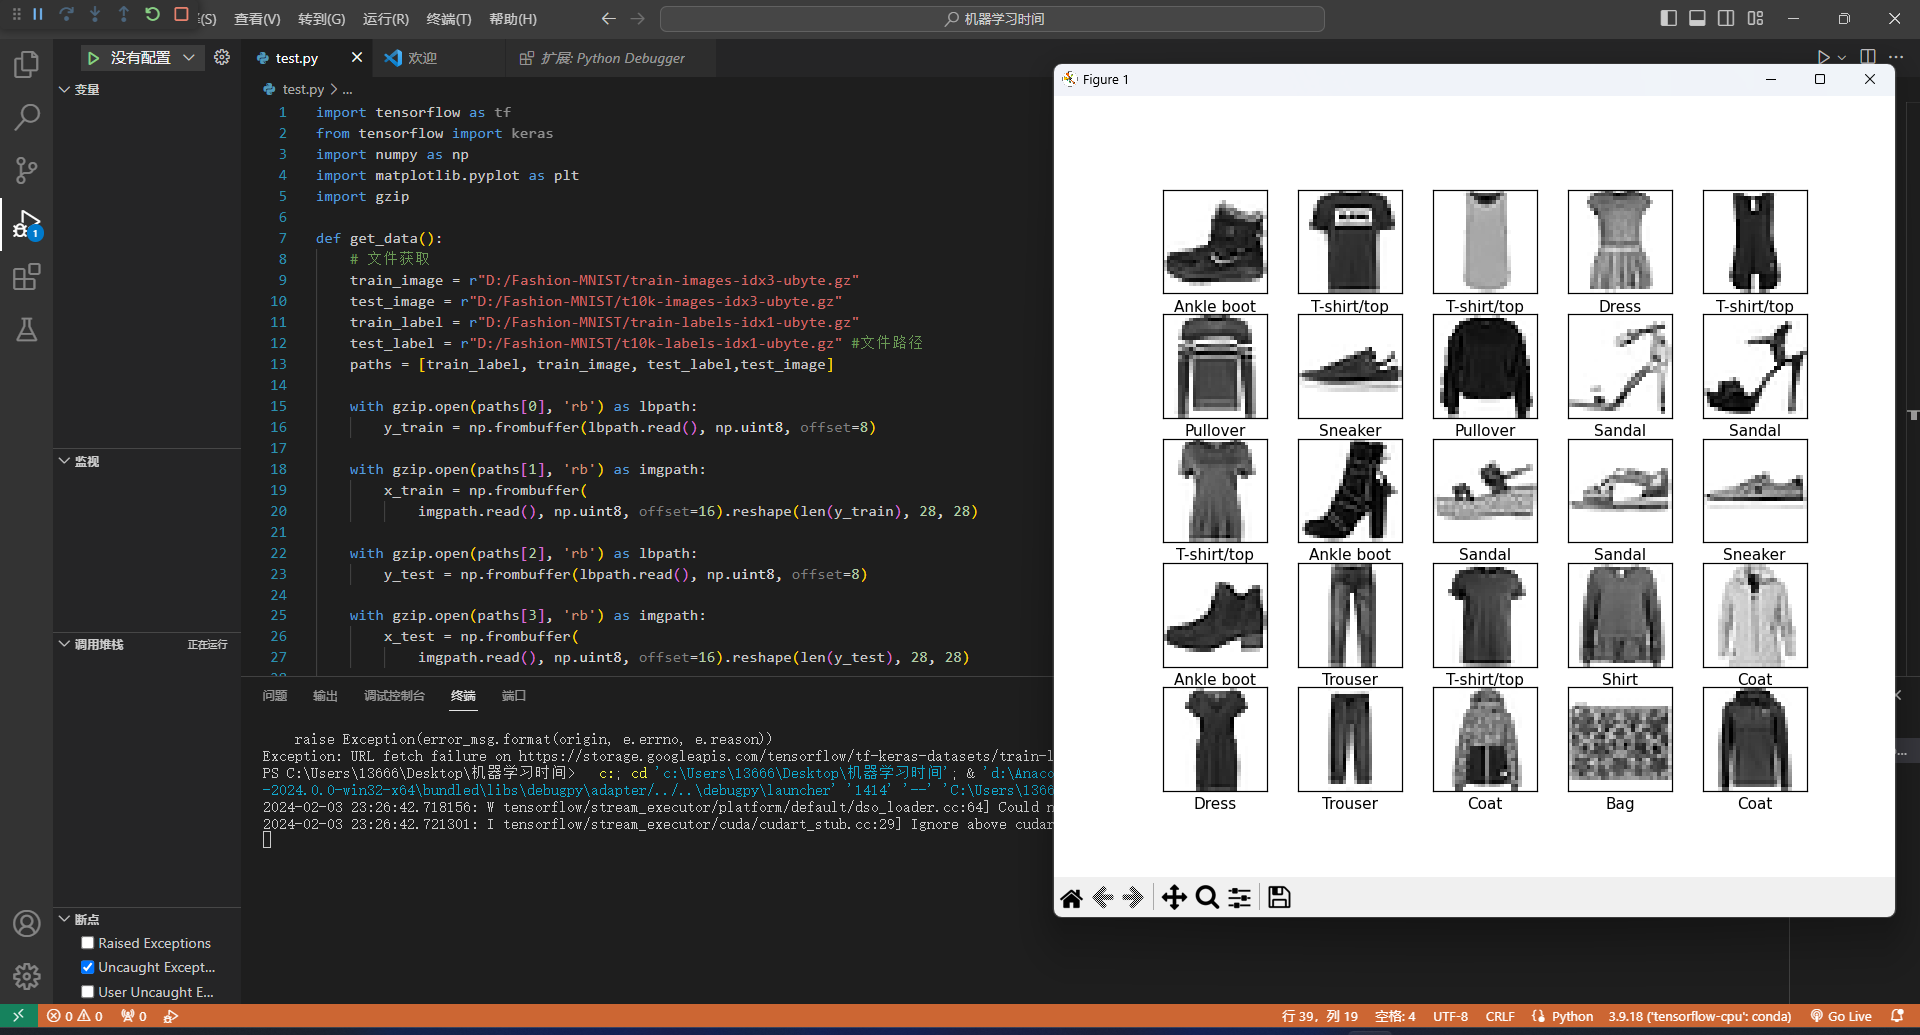
输出一下前25个图片,数据没问题

设置模型
model = tf.keras.Sequential([
    tf.keras.layers.Flatten(input_shape=(28, 28)),
    tf.keras.layers.Dense(128, activation='relu'),
    tf.keras.layers.Dense(10, activation = 'softmax'),
])
第一层Flatten将图像格式转换为一维数组,起到格式化数据的作用
第三层使用softmax进行多分类
编译模型
model.compile(optimizer='adam', # 优化器
              loss=tf.keras.losses.SparseCategoricalCrossentropy(from_logits=True), # 损失函数
              metrics=['accuracy']) # 指标
训练模型
model.fit(train_images, train_labels, epochs=10)
1875/1875 [==============================] - 3s 1ms/step - loss: 0.4974 - accuracy: 0.8257
Epoch 2/10
1875/1875 [==============================] - 2s 1ms/step - loss: 0.3744 - accuracy: 0.8651
Epoch 3/10
1875/1875 [==============================] - 2s 1ms/step - loss: 0.3361 - accuracy: 0.8791
Epoch 4/10
1875/1875 [==============================] - 2s 1ms/step - loss: 0.3138 - accuracy: 0.8852
Epoch 5/10
1875/1875 [==============================] - 2s 1ms/step - loss: 0.2958 - accuracy: 0.8915
Epoch 6/10
1875/1875 [==============================] - 2s 1ms/step - loss: 0.2799 - accuracy: 0.8971
Epoch 7/10
1875/1875 [==============================] - 2s 1ms/step - loss: 0.2685 - accuracy: 0.9011
Epoch 8/10
1875/1875 [==============================] - 2s 1ms/step - loss: 0.2570 - accuracy: 0.9044
Epoch 9/10
1875/1875 [==============================] - 2s 1ms/step - loss: 0.2478 - accuracy: 0.9083
Epoch 10/10
1875/1875 [==============================] - 2s 1ms/step - loss: 0.2395 - accuracy: 0.9110
313/313 - 0s - loss: 0.3441 - accuracy: 0.8804

Test accuracy: 0.8804000020027161
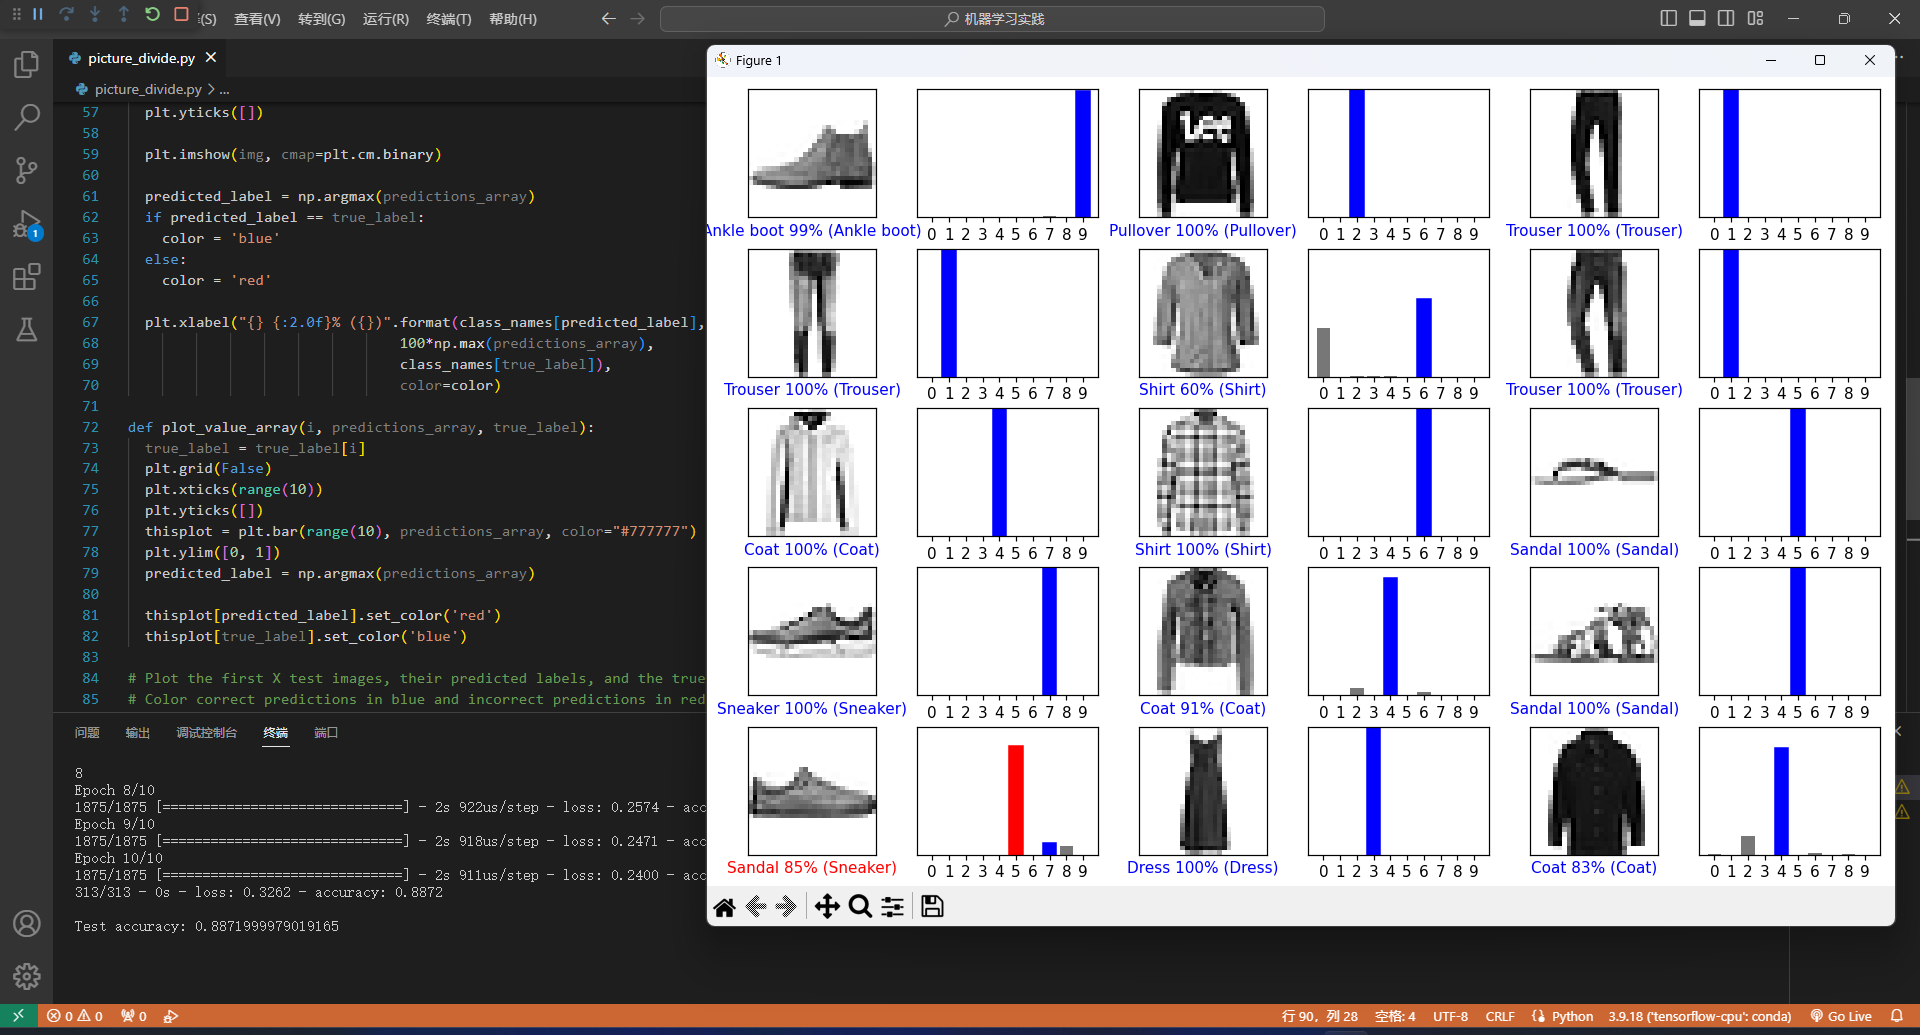
正确率还不错,模型在测试数据集上的准确率略低于训练数据集,说明有点过拟合。
对30个图像进行预测

完整代码
import tensorflow as tf
from tensorflow import keras
import numpy as np
import matplotlib.pyplot as plt
import gzip

# 获取本地FASHION_MNIST数据
def get_data():
    train_image = r"D:/Fashion-MNIST/train-images-idx3-ubyte.gz"
    test_image = r"D:/Fashion-MNIST/t10k-images-idx3-ubyte.gz"
    train_label = r"D:/Fashion-MNIST/train-labels-idx1-ubyte.gz"
    test_label = r"D:/Fashion-MNIST/t10k-labels-idx1-ubyte.gz" #文件路径
    paths = [train_label, train_image, test_label,test_image]

    with gzip.open(paths[0], 'rb') as lbpath:
        y_train = np.frombuffer(lbpath.read(), np.uint8, offset=8)

    with gzip.open(paths[1], 'rb') as imgpath:
        x_train = np.frombuffer(
            imgpath.read(), np.uint8, offset=16).reshape(len(y_train), 28, 28)

    with gzip.open(paths[2], 'rb') as lbpath:
        y_test = np.frombuffer(lbpath.read(), np.uint8, offset=8)

    with gzip.open(paths[3], 'rb') as imgpath:
        x_test = np.frombuffer(
            imgpath.read(), np.uint8, offset=16).reshape(len(y_test), 28, 28)

    return (x_train, y_train), (x_test, y_test)


(train_images, train_labels), (test_images, test_labels) = get_data()

class_names = ['T-shirt/top', 'Trouser', 'Pullover', 'Dress', 'Coat',
               'Sandal', 'Shirt', 'Sneaker', 'Bag', 'Ankle boot']

# 数据预处理
train_images = train_images / 255.0 # 将像素值压缩到0到1之间
test_images = test_images / 255.0

# 设置模型
model = tf.keras.Sequential([
    tf.keras.layers.Flatten(input_shape=(28, 28)), # 第一层Flatten将图像格式转换为一维数组,起到格式化数据的作用
    tf.keras.layers.Dense(128, activation='relu'), # 第二层有128个节点
    tf.keras.layers.Dense(10, activation = 'softmax'), # 第三层使用softmax实现多分类
])

# 编译模型
model.compile(optimizer='adam', # 优化器
              loss=tf.keras.losses.SparseCategoricalCrossentropy(from_logits=True), # 损失函数
              metrics=['accuracy']) # 指标

# 训练模型
model.fit(train_images, train_labels, epochs=10)

# 输出准确率
test_loss, test_acc = model.evaluate(test_images,  test_labels, verbose=2)
print('\nTest accuracy:', test_acc)

predictions = model.predict(test_images)

# 取前25个数据进行预测
def plot_image(i, predictions_array, true_label, img):
  true_label, img = true_label[i], img[i]
  plt.grid(False)
  plt.xticks([])
  plt.yticks([])

  plt.imshow(img, cmap=plt.cm.binary)

  predicted_label = np.argmax(predictions_array)
  if predicted_label == true_label:
    color = 'blue'
  else:
    color = 'red'

  plt.xlabel("{} {:2.0f}% ({})".format(class_names[predicted_label],
                                100*np.max(predictions_array),
                                class_names[true_label]),
                                color=color)

def plot_value_array(i, predictions_array, true_label):
  true_label = true_label[i]
  plt.grid(False)
  plt.xticks(range(10))
  plt.yticks([])
  thisplot = plt.bar(range(10), predictions_array, color="#777777")
  plt.ylim([0, 1])
  predicted_label = np.argmax(predictions_array)

  thisplot[predicted_label].set_color('red')
  thisplot[true_label].set_color('blue')

# Plot the first X test images, their predicted labels, and the true labels.
# Color correct predictions in blue and incorrect predictions in red.
num_rows = 5
num_cols = 3
num_images = num_rows*num_cols
plt.figure(figsize=(2*2*num_cols, 2*num_rows))
for i in range(num_images):
  plt.subplot(num_rows, 2*num_cols, 2*i+1)
  plot_image(i, predictions[i], test_labels, test_images)
  plt.subplot(num_rows, 2*num_cols, 2*i+2)
  plot_value_array(i, predictions[i], test_labels)
plt.tight_layout()
plt.show()


