matplotlib formatters
Tick formatting is controlled by classes derived from Formatter. The formatter
operates on a single tick value and returns a string to the axis. -- matplotlib document
Tips: To control the major and minor tick label formats, use one of the
following methods::
ax.xaxis.set_major_formatter(xmajor_formatter)
ax.xaxis.set_minor_formatter(xminor_formatter)
ax.yaxis.set_major_formatter(ymajor_formatter)
ax.yaxis.set_minor_formatter(yminor_formatter)
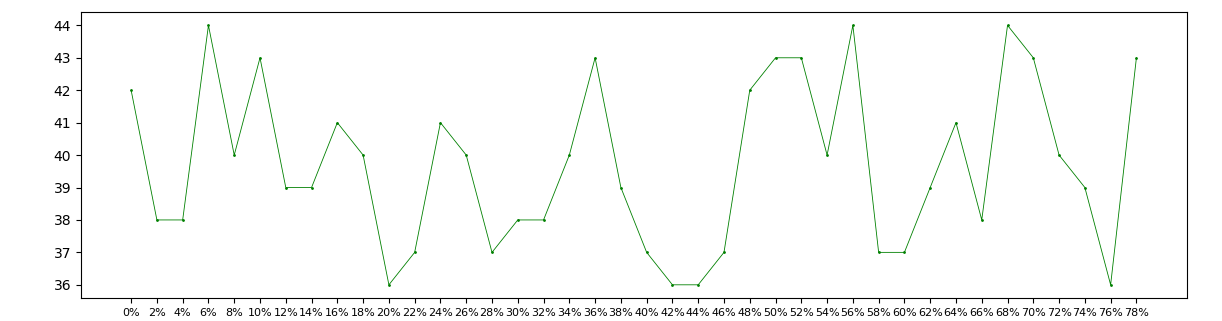
Figure without formatter:
![]()
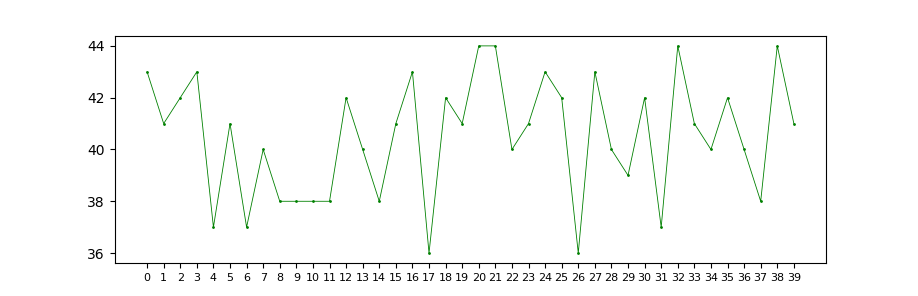
#!/usr/bin/python
# _*_ Coding: Utf-8 _*_

import matplotlib.pyplot as plt
import numpy as np
import random
from matplotlib.ticker import *

t = [str(i) for i in range(40)]
# t = [str(10**i) for i in range(-5, 5)]  # test data for scaler, eng formatter
s = [36 + random.randint(0, 8) for i in range(40)]

fig, axes = plt.subplots()

axes.plot(t, s, 'go-', markersize=1, linewidth=0.6)
axes.tick_params(axis='x', labelsize=8)  # tick_params
axes.set_xticks(t)  # set ticks

fig.tight_layout()
plt.show()
- NullFormatter
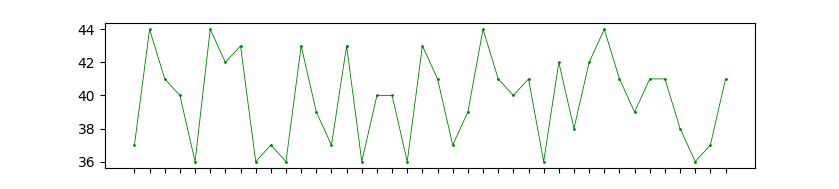
nullFormatter = NullFormatter() # null formatter
-
FixedFormatter

fixedFormatter = FixedFormatter(['1', 'show', '2', 'to', '3', 'you', '4', 'yeah']) # fixed formatter
-
IndexFormatter
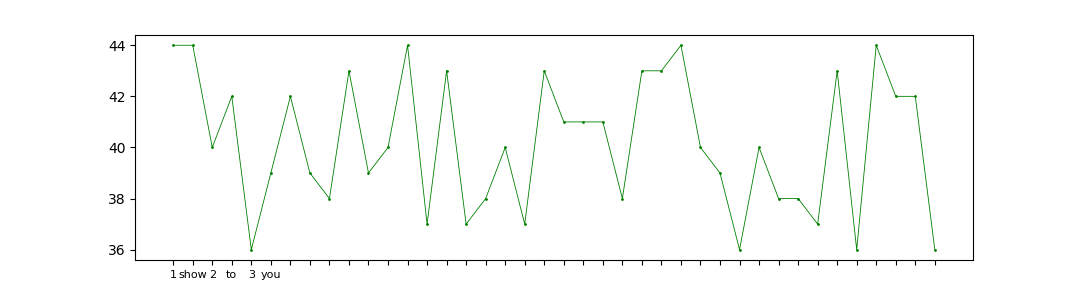
indexFormatter = IndexFormatter(['1', 'show', '2', 'to', '3', 'you']) # index deceid
-
FormatStrFormatter
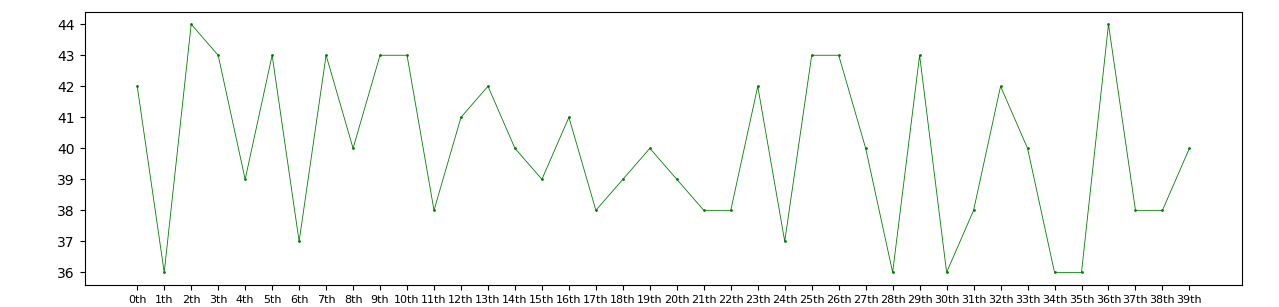
formatStrFormatter = FormatStrFormatter("%dth") # Use an old-style ('%' operator) format string to format the tick.
-
StrMethodFormatter

strMethodFormatter = StrMethodFormatter("{x}|{pos}") # `x` and `pos` are passed to `str.format` as keyword arguments
-
PercentFormatter
percentFormatter = PercentFormatter(xmax=50, decimals=None, symbol='%', is_latex=False) # Format numbers as a percentage
-
funcFormatter
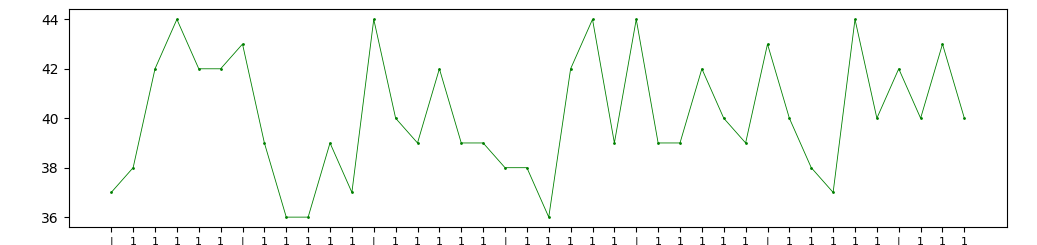
def my_formatter_func(x, pos = None):
    if x % 6 == 0:
        return "|"
    else:
        return "1"

funcFormatter = FuncFormatter(func=my_formatter_func)  # user-defined func

 浙公网安备 33010602011771号