
CSV文件格式
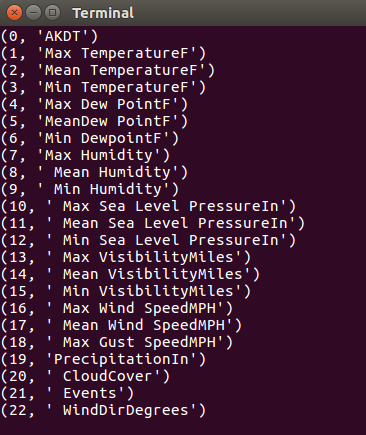
1.分析CSV文件头
import csv

filename='sitka_weather_07-2014.csv'
with open(filename) as f:
    reader=csv.reader(f)
    header_row=next(reader)

    for index,column_header in enumerate(header_row):
        print(index,column_header)
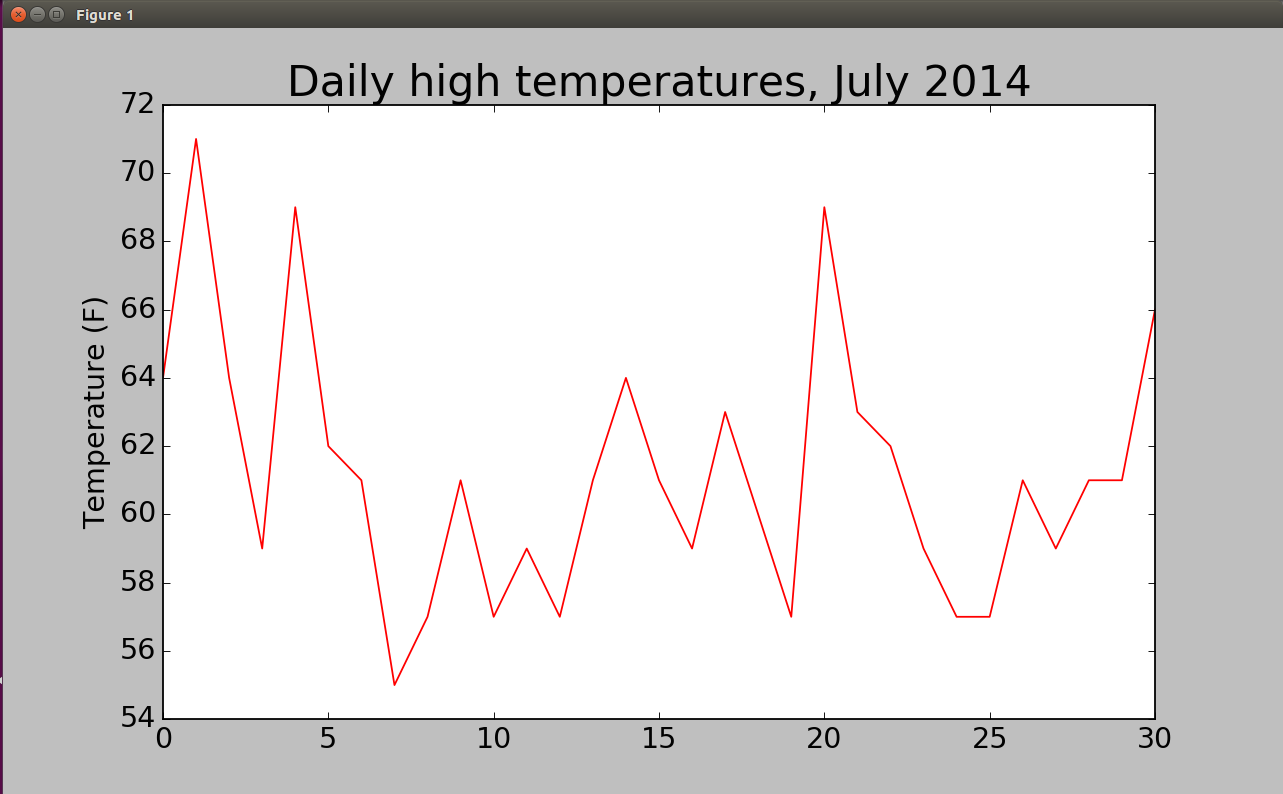
2.提取最高气温数据并绘制图表
from matplotlib import pyplot as plt
import csv

filename='sitka_weather_07-2014.csv'
with open(filename) as f:
    reader=csv.reader(f)
    header_row=next(reader)
    highs=[]
    for row in reader:
        highs.append(int(row[1]))

    plt.figure(dpi=128,figsize=(10,6))
    plt.plot(highs,c='red')
    plt.title("Daily high temperatures, July 2014",fontsize=24)
    plt.xlabel('',fontsize=16)
    plt.ylabel("Temperature (F)",fontsize=16)
    plt.tick_params(axis='both',which='major',labelsize=16)

    plt.show()
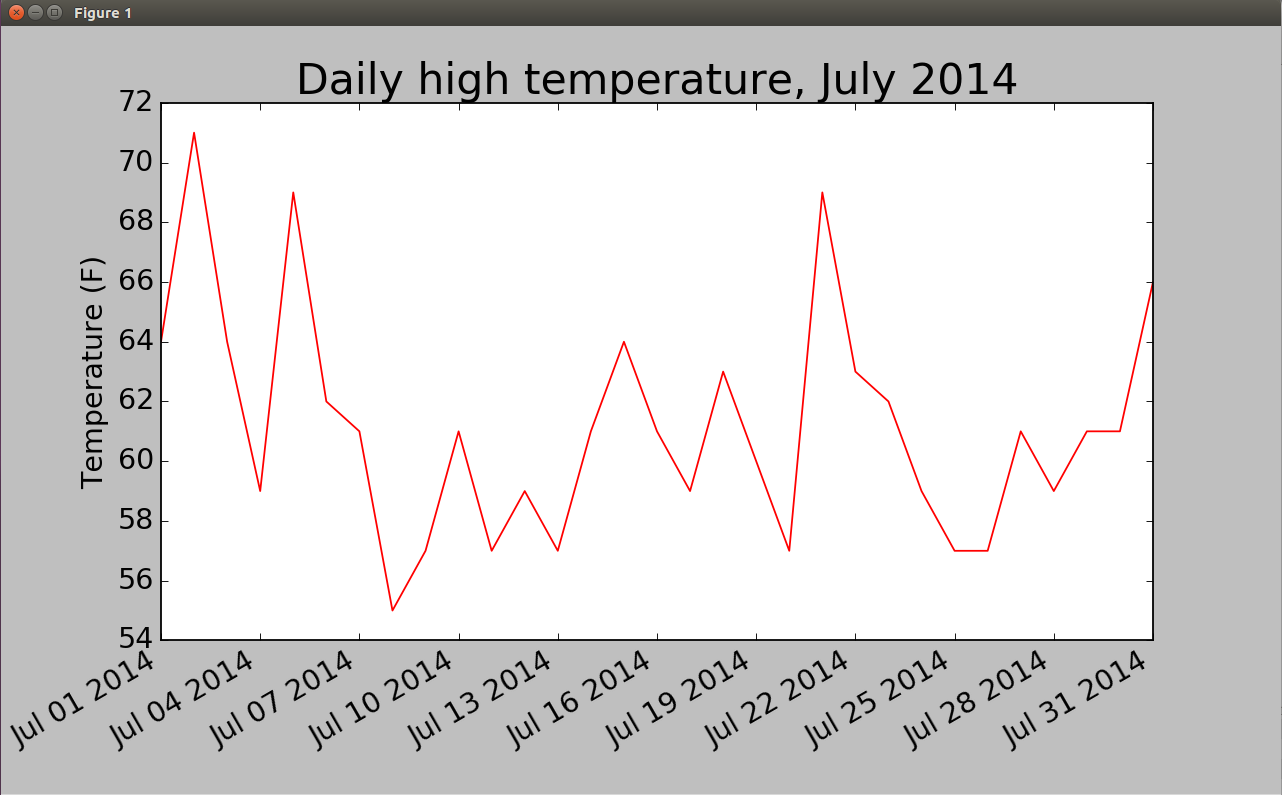
3.在图表中添加日期
我们先试着输出第二行:
['2014-7-1', '64', '56', '50', '53', '51', '48', '96', '83', '58', '30.19', '30.00', '29.79', '10', '10', '10', '7', '4', '', '0.00', '7', '', '337']
需要将字符串'2014-7-1'转换为一个表示相应日期的对象,可使用模块datetime中的方法strptime()
from matplotlib import pyplot as plt
from datetime import datetime
import csv

filename='sitka_weather_07-2014.csv'
with open(filename) as f:
    reader=csv.reader(f)
    header_row=next(reader)

    dates,highs=[],[]
    for row in reader:
        current_date=datetime.strptime(row[0],"%Y-%m-%d")
        dates.append(current_date)
        highs.append(int(row[1]))

fig=plt.figure(dpi=128,figsize=(10,6))
plt.plot(dates,highs,c='red')

plt.title("Daily high temperature, July 2014", fontsize=24)
plt.xlabel("",fontsize=16)
plt.ylabel("Temperature (F)",fontsize=16)
fig.autofmt_xdate()
plt.tick_params(axis='both',which='major',labelsize=16)

plt.show()
这其中我们调用了fig.autofmt_xdate()来绘制斜的日期标签,以免它们彼此重叠。
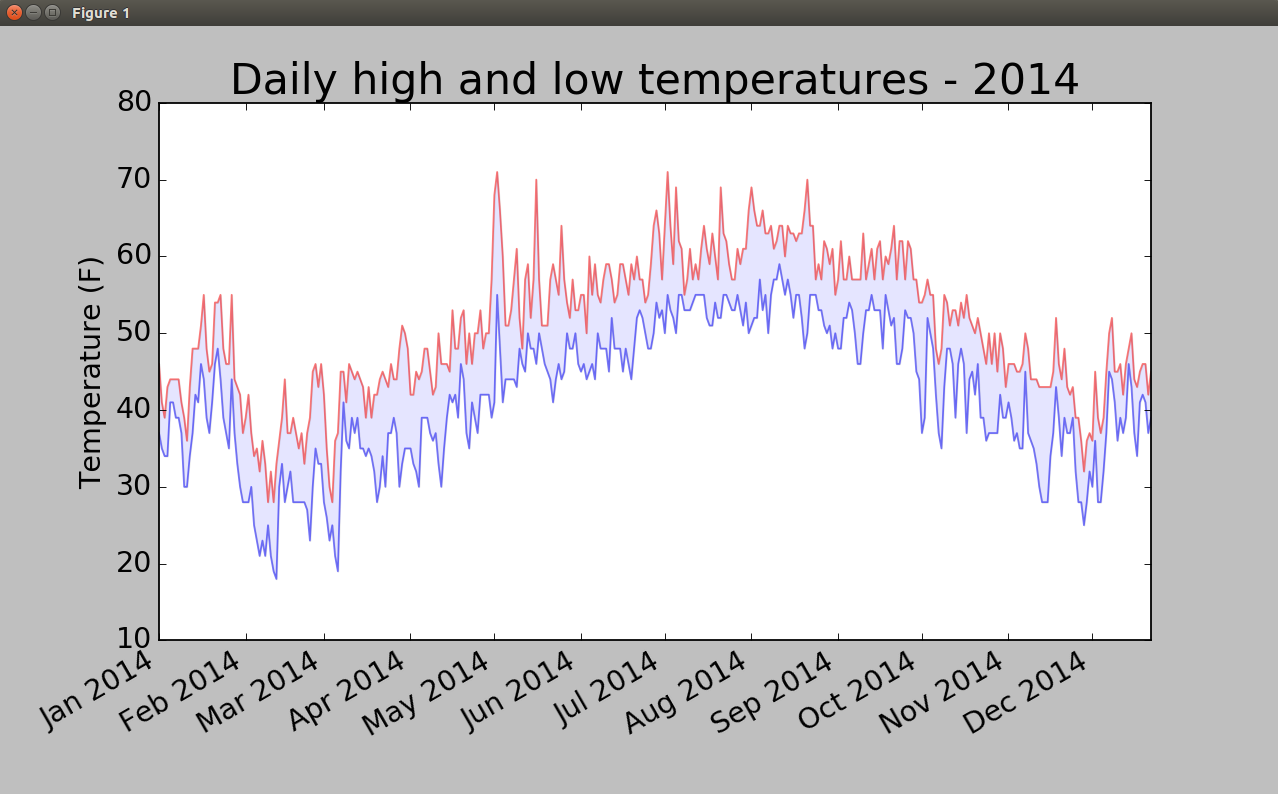
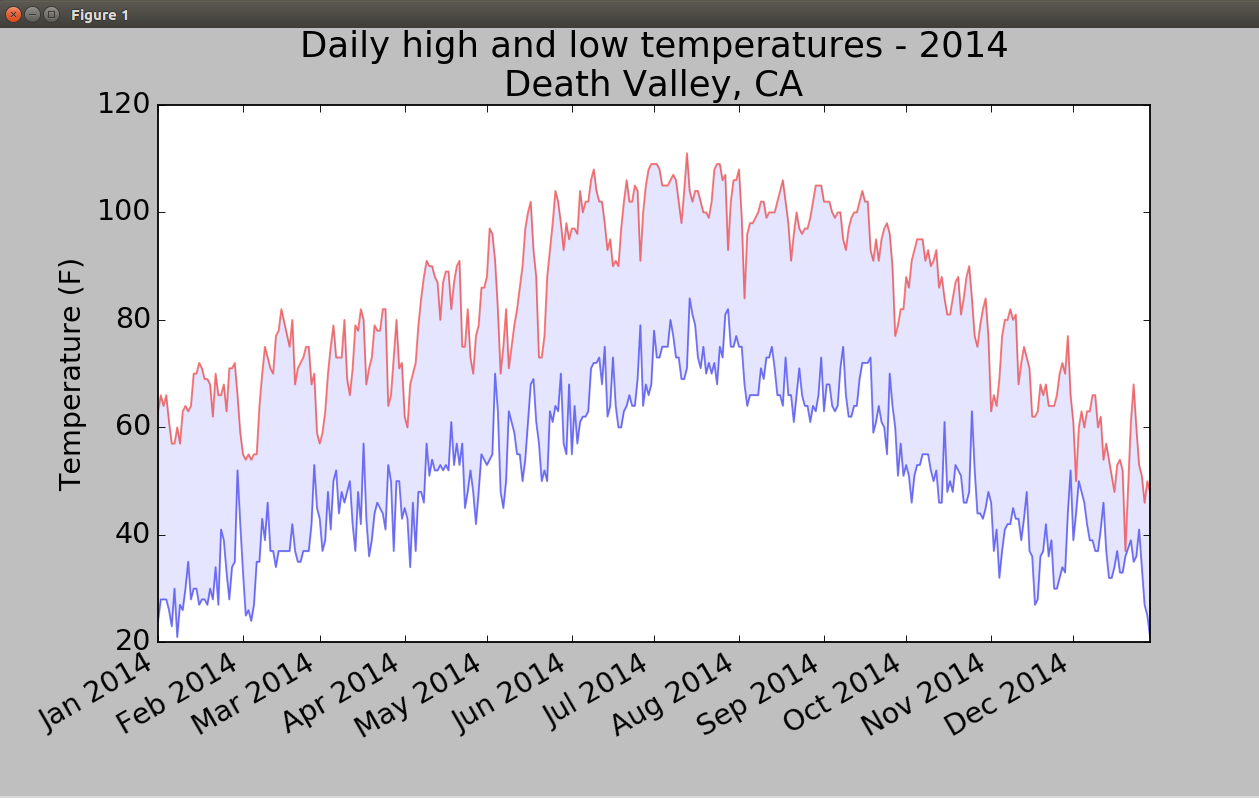
4.绘制锡特卡2014高温低温图
首先再添加一个数据系列-最低气温,使用方法fill_between(),它接受一个x值系列和两个y值系列,并填充两个y值系列之间的空间(参数alpha指定颜色的透明度):
from matplotlib import pyplot as plt
from datetime import datetime
import csv

filename='sitka_weather_2014.csv'
with open(filename) as f:
    reader=csv.reader(f)
    header_row=next(reader)

    dates,highs,lows=[],[],[]
    for row in reader:
        current_date=datetime.strptime(row[0],"%Y-%m-%d")
        dates.append(current_date)
        highs.append(int(row[1]))
        lows.append(int(row[3]))

fig=plt.figure(dpi=128,figsize=(10,6))
plt.plot(dates,highs,c='red',alpha=0.5)
plt.plot(dates,lows,c='blue',alpha=0.5)
plt.fill_between(dates,highs,lows,facecolor='blue',alpha=0.1)

plt.title("Daily high and low temperatures - 2014", fontsize=24)
plt.xlabel("",fontsize=16)
plt.ylabel("Temperature (F)",fontsize=16)
fig.autofmt_xdate()
plt.tick_params(axis='both',which='major',labelsize=16)

plt.show()
5.错误检查
有些气象站会偶尔出现故障,未能收集部分或全部其应该收集的数据。缺失数据可能会引发异常,如果不妥善地处理,还可能导致程序崩溃。
我们换用加利福尼亚死亡谷的气温图,运行程序时报错:
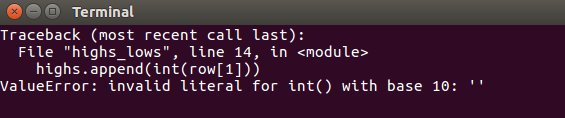
该traceback指出,Python无法处理其中一天的最高气温,因为它无法将空字符串(' ')转化为整数。
查看 death_valley_2014.csv,就能发现其中的问题:
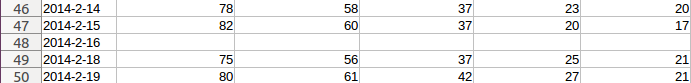
其中没有2014年2月16日的数据,为解决这种问题,我们在读取CSV数据时执行错误检查代码,对可能出现的异常进行处理:
for row in reader:
        try:
            current_date=datetime.strptime(row[0],"%Y-%m-%d")
            high=int(row[1])
            low=int(row[3])
        except ValueError:
            print(current_date,' missing data')
        else:
            dates.append(current_date)
            highs.append(high)
            lows.append(low)
只要缺失其中一项数据,就会引发ValueError异常,而我们可这样处理:打印一条错误消息,并指出缺失数据的日期。
运行程序,将发生缺失数据的日期只有一个:


 浙公网安备 33010602011771号