10 Dashboard 图像管理(转载)
Dashboard 图形管理
Dashboard Web 概述
日常可以通过 Ceph 原生的命令行和 Rook 提供的云原生方式对 Ceph 进行管理,这两种方式都具有一定的难度, Ceph 提供了一种更加简单的方式使用和 Ceph 监控,这个工具便是 Ceph Dashboard , Ceph dashboard 官方展板介绍地址,它是一个 WebUI 的图形管理方式,能够提供两个方面的功能:
Ceph管理: 如Pool,RBD,CephFS的日常管理接口- 性能监控: 监控
Ceph的健康状态,如Mon,OSD,mgr等
启用 Dashboard 组件
Rook 默认在 cluster.yaml 文件中已经启用了 Ceph Dashboard 组件,集成在 mgr 内部,不需要任何的配置即可使用(免去了包的安装,插件启用,SSL证书,端口等配置过程),使用非常简单
[root@m1 ceph]# vim cluster.yaml
 16 spec:
      ......
 46   mgr:
 47     modules:
 48     # Several modules should not need to be included in this list. The "dashboard" and "monitoring" modules
 49     # are already enabled by other settings in the cluster CR.
 50     - name: pg_autoscaler
 51       enabled: true
 52   # enable the ceph dashboard for viewing cluster status
 53   dashboard:
 54     enabled: true
Ceph Dashboard 默认会通过 service 的方式将服务暴露给外部,通过 8443 的 https 端口进行访问,如下:
[root@m1 ceph]# kubectl -n rook-ceph get svc -l app=rook-ceph-mgr
NAME                      TYPE        CLUSTER-IP     EXTERNAL-IP   PORT(S)    AGE
rook-ceph-mgr             ClusterIP   10.68.82.138   <none>        9283/TCP   2d21h
rook-ceph-mgr-dashboard   ClusterIP   10.68.153.82   <none>        8443/TCP   2d21h
暴露 Dashboard 访问
通过 NodePort 的形式将 dashboard 服务暴露给 kubernetes 集群外部访问,外部通过 nodeport 端口访问 dashbaord 服务
[root@m1 ceph]# cat dashboard-external-https.yaml
apiVersion: v1
kind: Service
metadata:
  name: rook-ceph-mgr-dashboard-external-https
  namespace: rook-ceph # namespace:cluster
  labels:
    app: rook-ceph-mgr
    rook_cluster: rook-ceph # namespace:cluster
spec:
  ports:
  - name: dashboard
    port: 8443
    protocol: TCP
    targetPort: 8443
  selector:
    app: rook-ceph-mgr
    rook_cluster: rook-ceph
  sessionAffinity: None
  type: NodePort
启用之后,可以看到 rook-ceph-mgr-dashboard-external-https 的 service ,其类型是 NodePort ,协商端口是 35832
[root@m1 ceph]# kubectl apply -f dashboard-external-https.yaml
service/rook-ceph-mgr-dashboard-external-https created

[root@m1 ceph]# kubectl -n rook-ceph get svc -l app=rook-ceph-mgr
NAME                                     TYPE        CLUSTER-IP     EXTERNAL-IP   PORT(S)          AGE
rook-ceph-mgr                            ClusterIP   10.68.82.138   <none>        9283/TCP         2d21h
rook-ceph-mgr-dashboard                  ClusterIP   10.68.153.82   <none>        8443/TCP         2d21h
rook-ceph-mgr-dashboard-external-https   NodePort    10.68.41.90    <none>        8443:35832/TCP   3s
默认 mgr 创建了一个 admin 的用户,其密码存放在 rook-ceph-dashboard-password 的 secrets 对象中,通过如下方式可以获取到
[root@m1 ceph]# kubectl -n rook-ceph get secrets rook-ceph-dashboard-password -o yaml
apiVersion: v1
data:
  password: YUwoQHZRbDZEUDNMVi1RVjJtJjc=
kind: Secret
metadata:
  .......
  name: rook-ceph-dashboard-password
  namespace: rook-ceph
  ownerReferences:
  - apiVersion: ceph.rook.io/v1
    blockOwnerDeletion: true
    controller: true
    kind: CephCluster
    name: rook-ceph
    uid: 8279c0cb-e44f-4af6-8689-115025bb2940
  resourceVersion: "406376"
  uid: f323fd0e-e38a-4eed-a90a-c4e844c231ee
type: kubernetes.io/rook
登陆 Ceph Dashboard 界面
用户:
admin,密码从secrets中获取
[root@m1 ceph]# kubectl -n rook-ceph get secrets rook-ceph-dashboard-password -o yaml -o jsonpath={.data.password} | base64 -d
aL(@vQl6DP3LV-QV2m&7
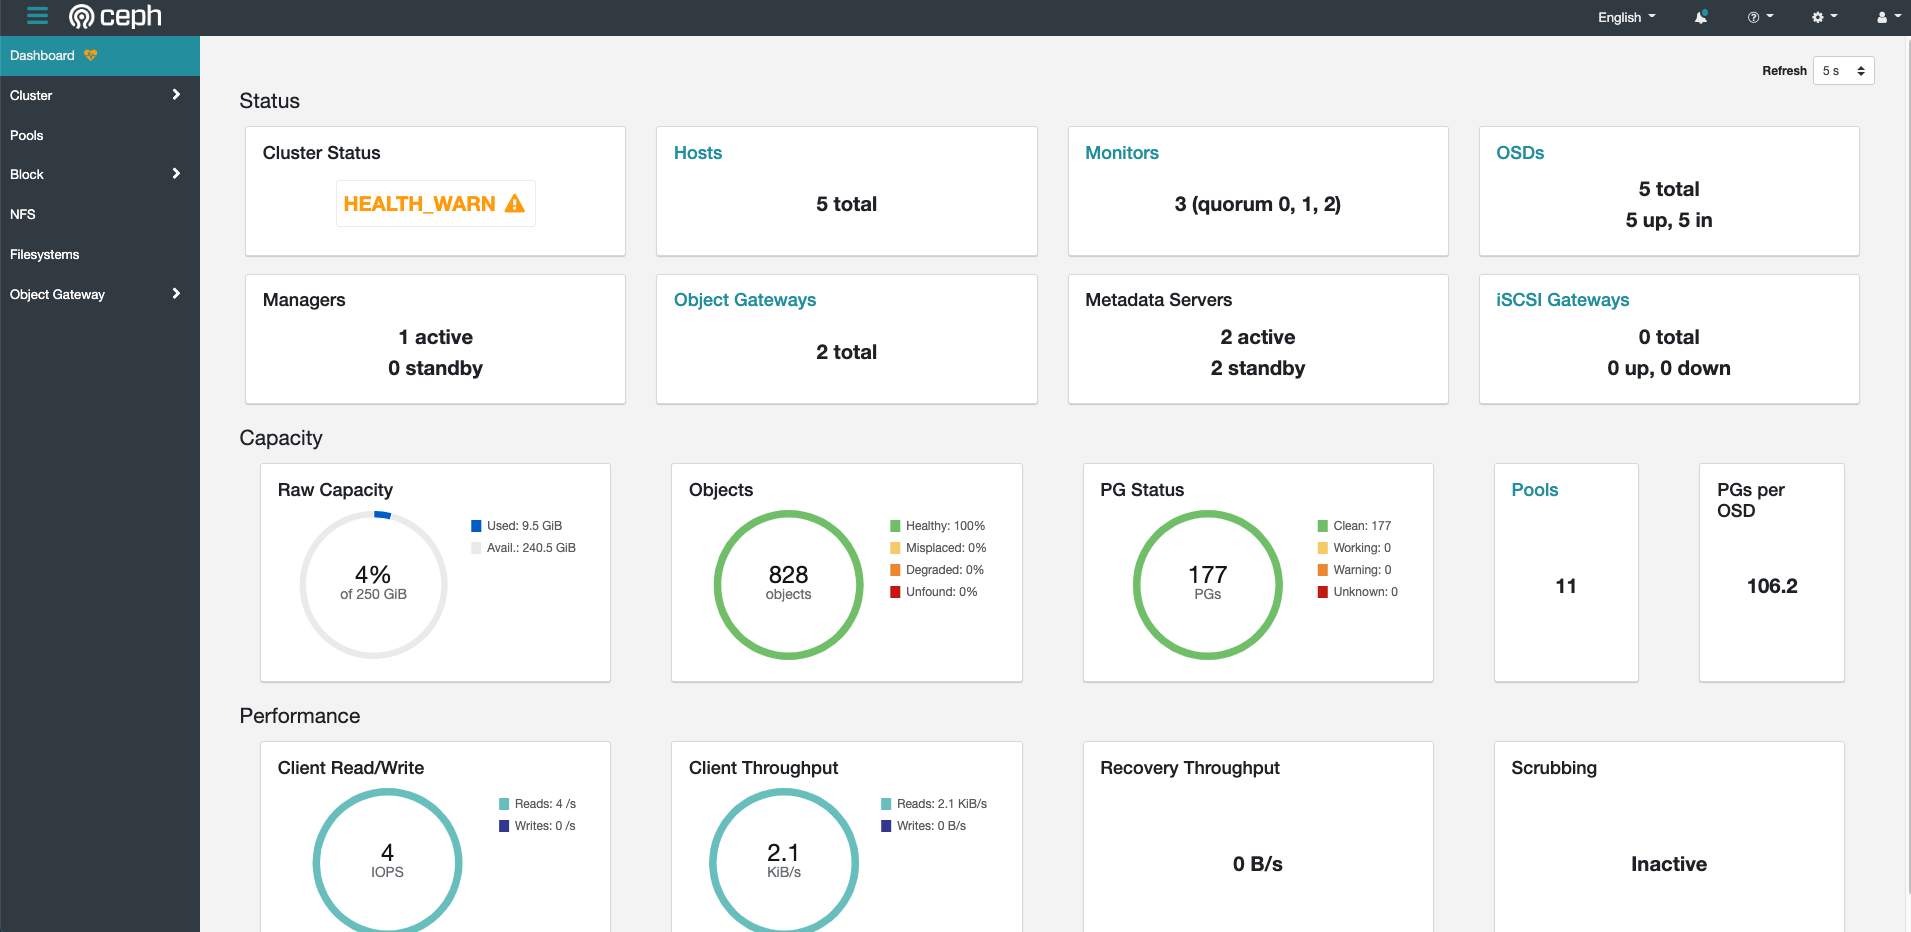
Dashboard 监控 Ceph
Dashboard 提供了图形界面的功能,能够监控完成 Ceph 监控所需的功能,包括:
- 集群监控,包含各组件的监控,如
MON,MGR,RGW,OSD,HOST等 - 容量监控,容量使用情况,
Objects数量,Pool状态,PGs状态,Pool等; - 性能监控,如客户端读写性能,吞吐量量,恢复
Recovery流量,Scrubbing等
Ceph 整体监控
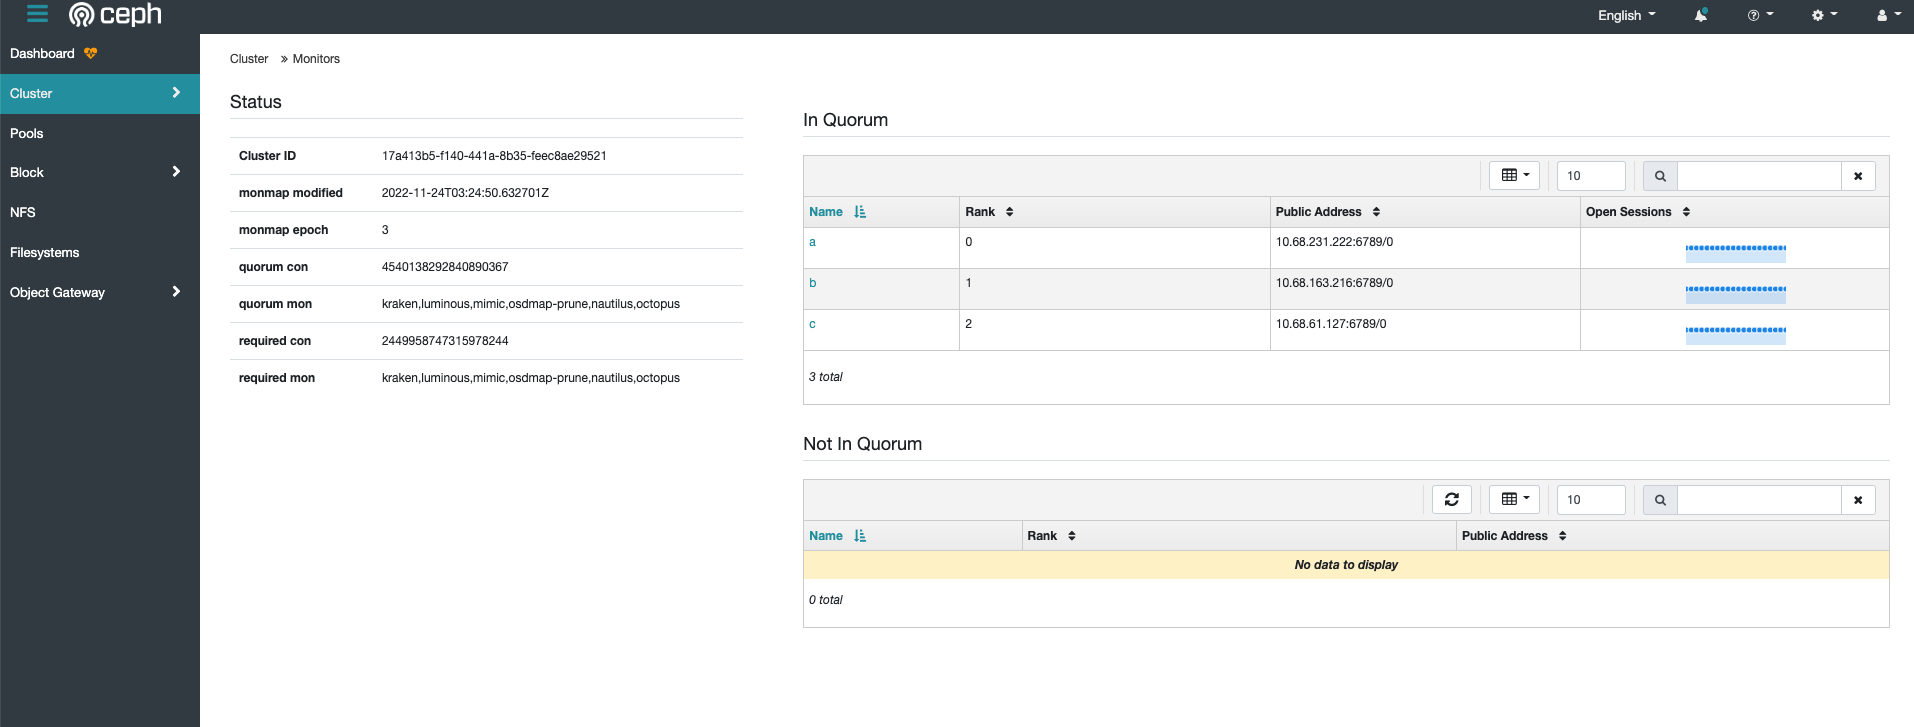
Monitor 监控
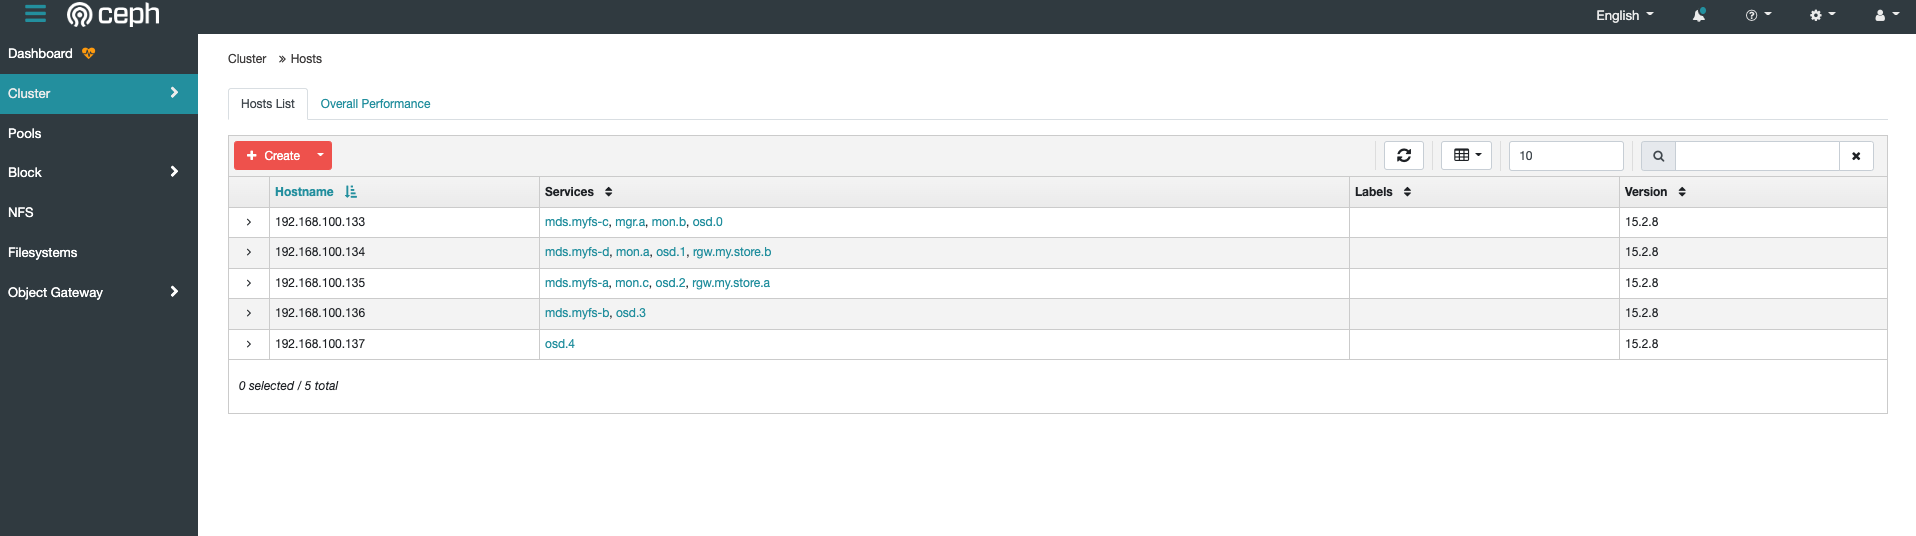
HOST 主机监控
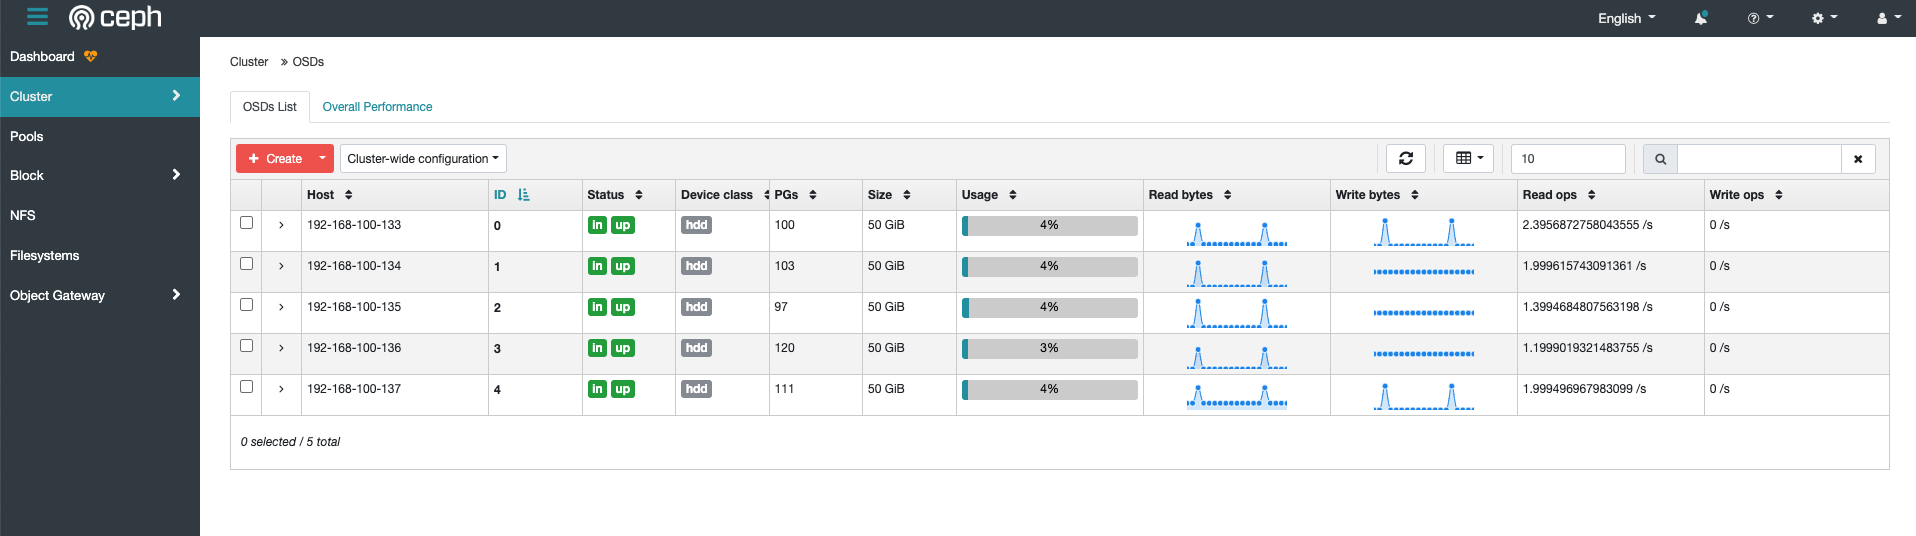
OSD 监控
Dashboard 管理 Ceph
Ceph 还提供了部分管理 Ceph 的功能,如 Pool,RBD 块存储,RGW对象存储等
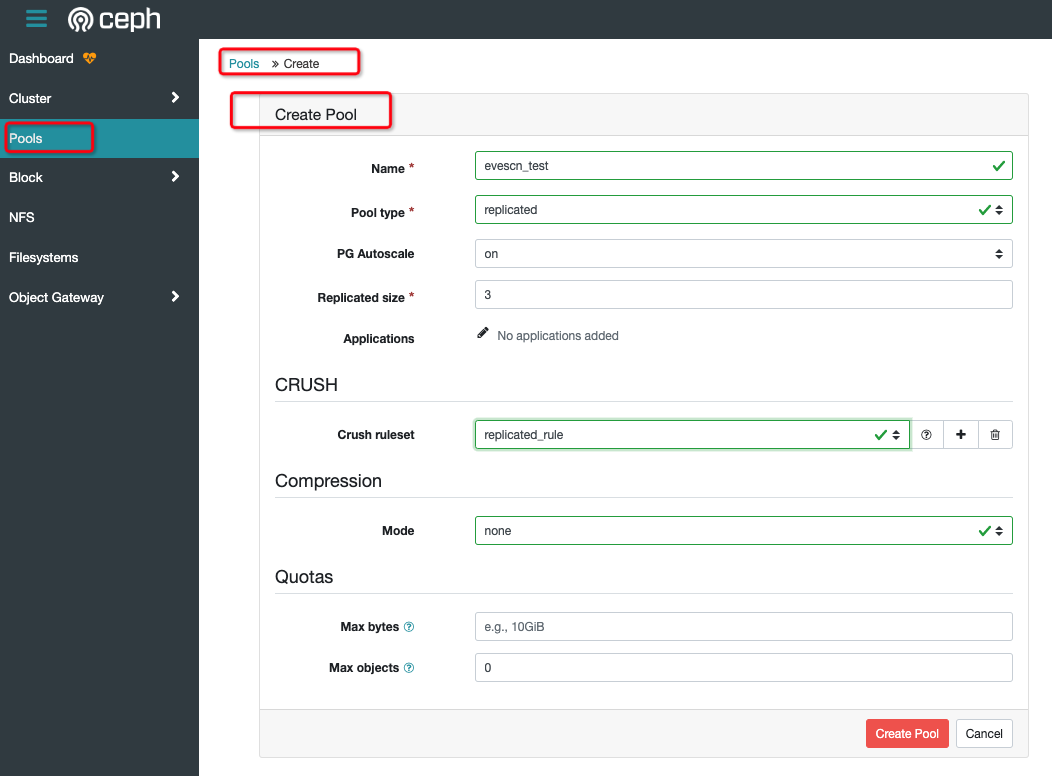
创建 pool
- 创建
pool
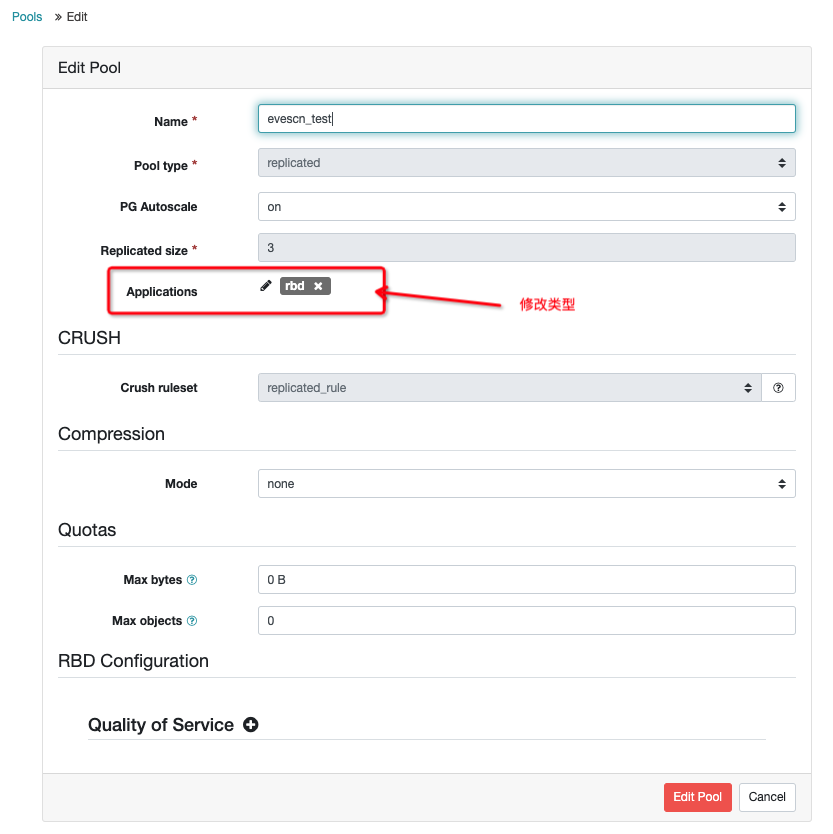
- 修改
pool类型,后续创建RBD使用
- 图形查看
pool信息
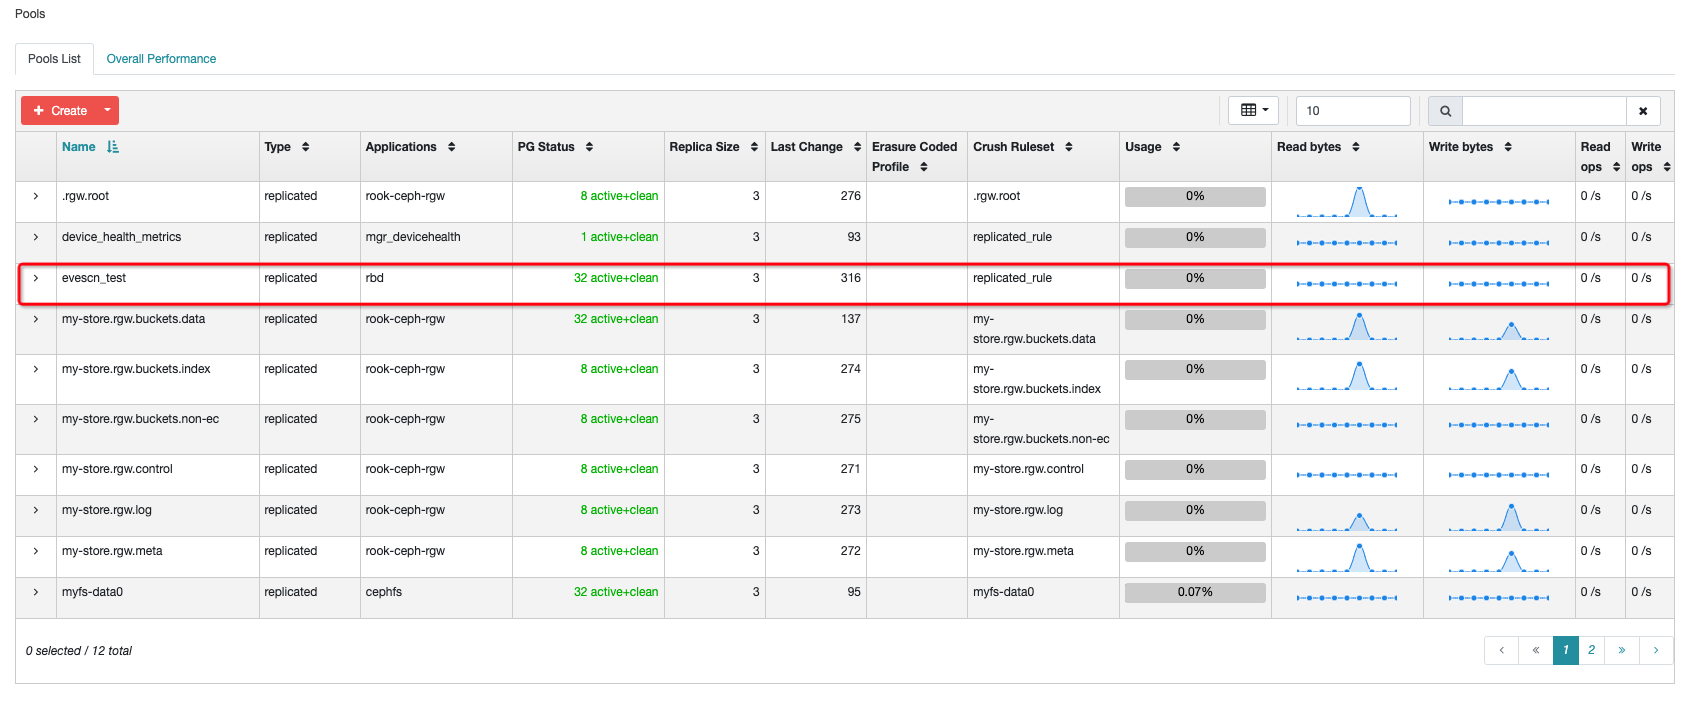
- 命令行查看
pool信息
[root@m1 ceph]# ceph osd lspools
1 device_health_metrics
2 replicapool
3 myfs-metadata
4 myfs-data0
5 my-store.rgw.control
6 my-store.rgw.meta
7 my-store.rgw.log
8 my-store.rgw.buckets.index
9 my-store.rgw.buckets.non-ec
10 .rgw.root
11 my-store.rgw.buckets.data
12 evescn_test
创建 RBD 块
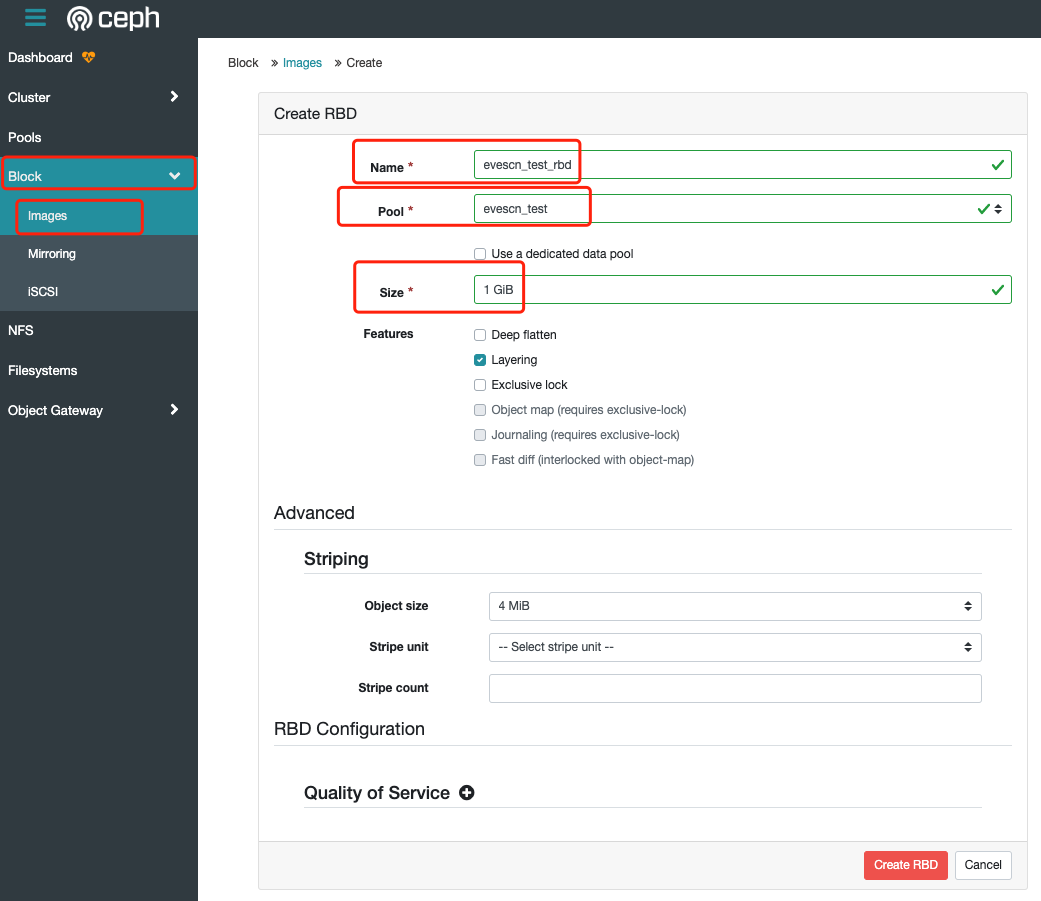
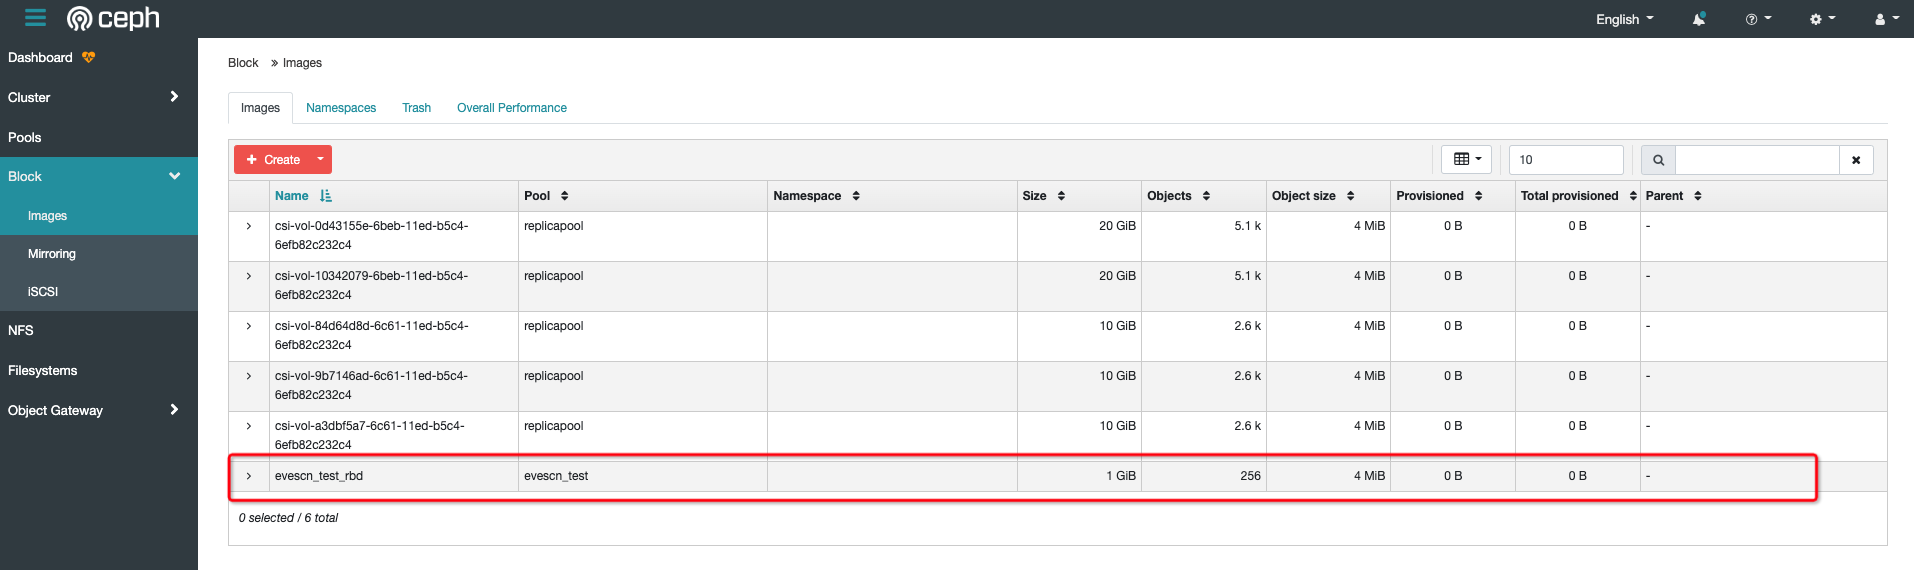
[root@m1 ceph]# rbd -p evescn_test ls
evescn_test_rbd

[root@m1 ceph]# rbd -p evescn_test info evescn_test_rbd
rbd image 'evescn_test_rbd':
        size 1 GiB in 256 objects
        order 22 (4 MiB objects)
        snapshot_count: 0
        id: 8e17bce2d88d3
        block_name_prefix: rbd_data.8e17bce2d88d3
        format: 2
        features: layering
        op_features:
        flags:
        create_timestamp: Sun Nov 27 11:01:18 2022
        access_timestamp: Sun Nov 27 11:01:18 2022
        modify_timestamp: Sun Nov 27 11:01:18 2022
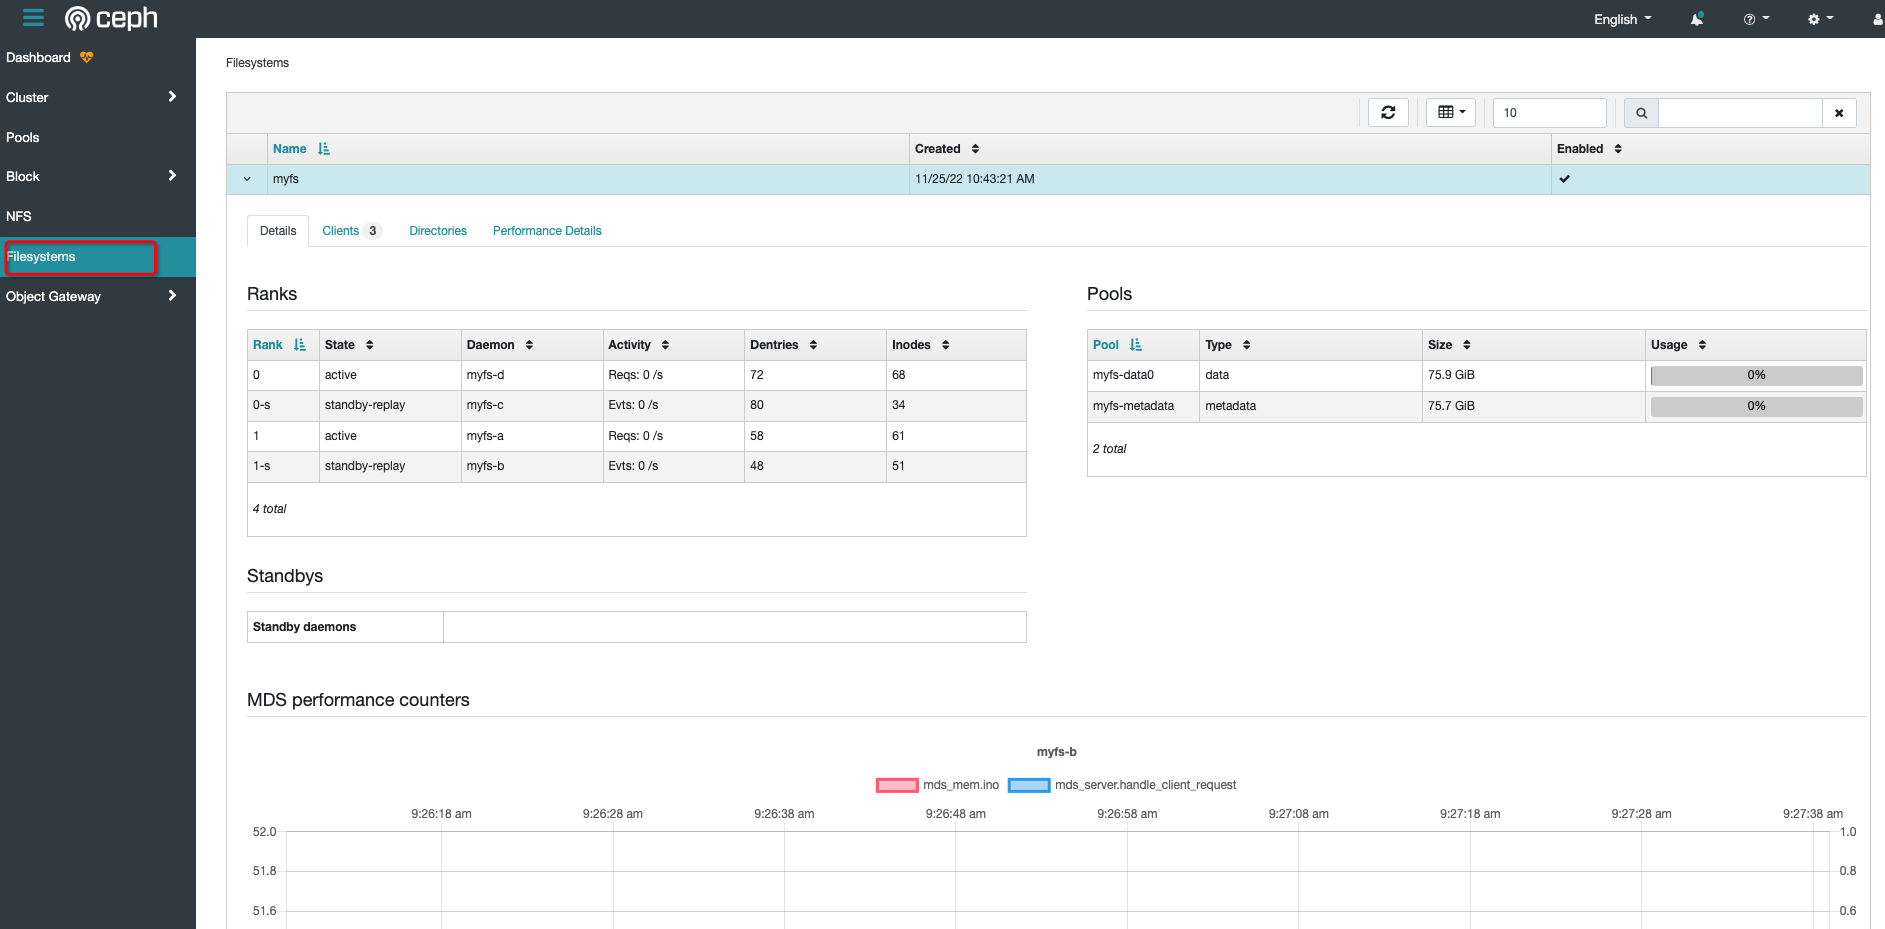
查看 CephFS 信息
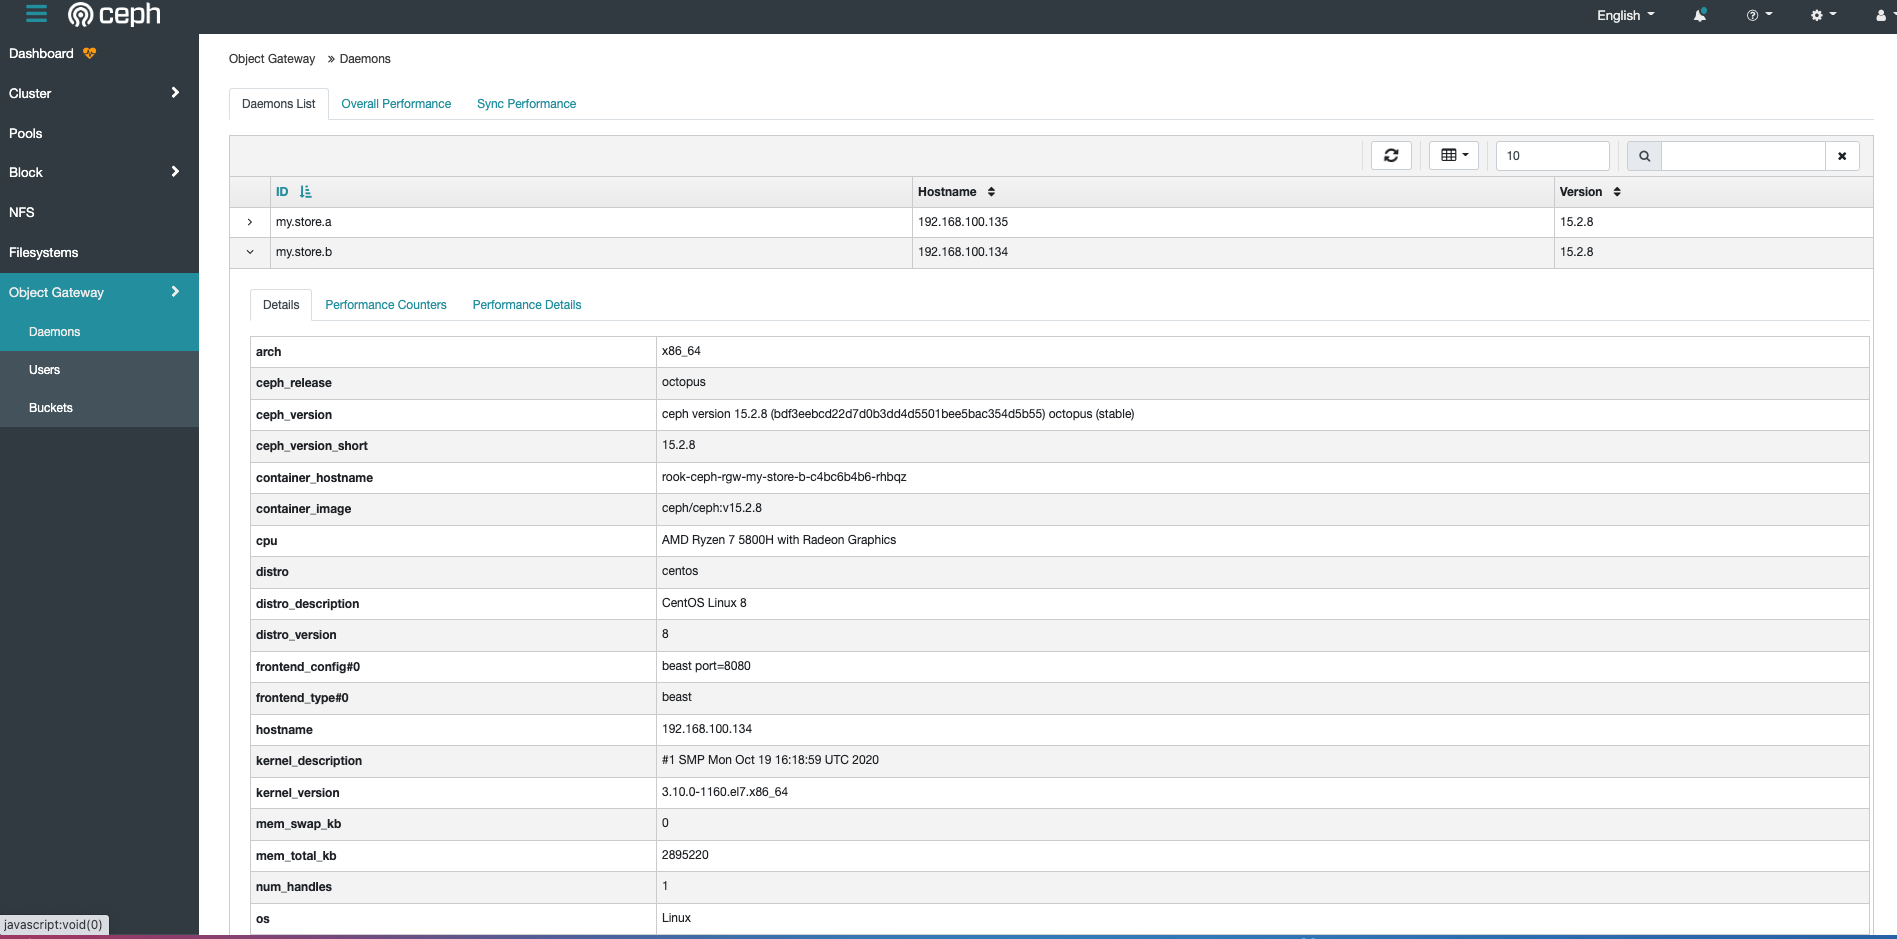
管理 Object Gateway
- 查看
Object Gateway信息
- 查看
User信息
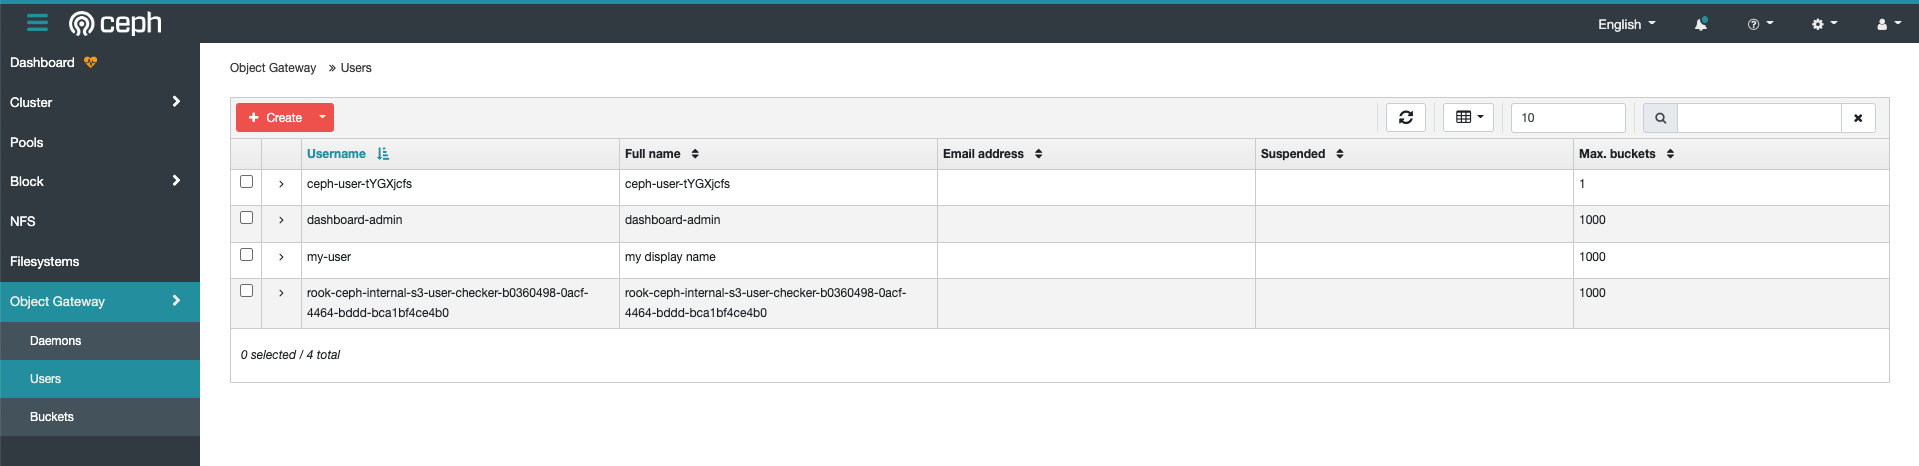
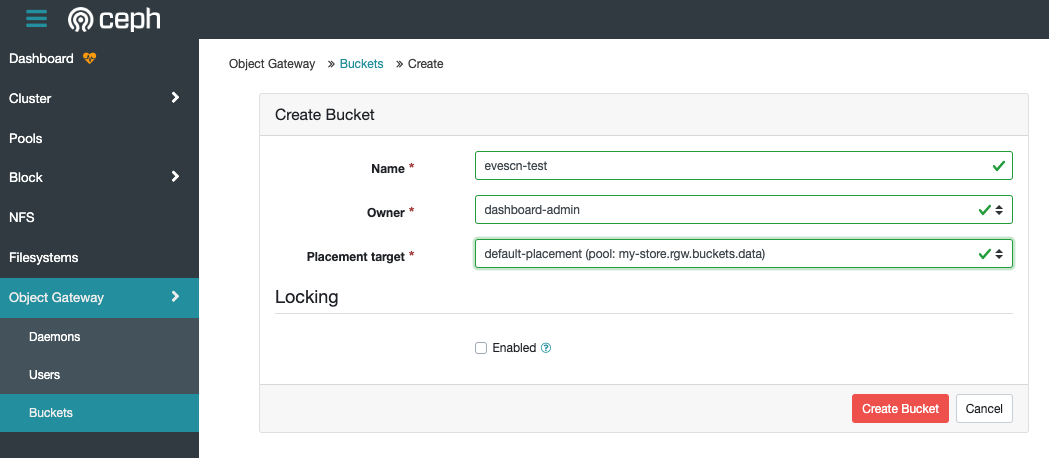
- 创建
Buckets
- 查看
Buckets桶信息
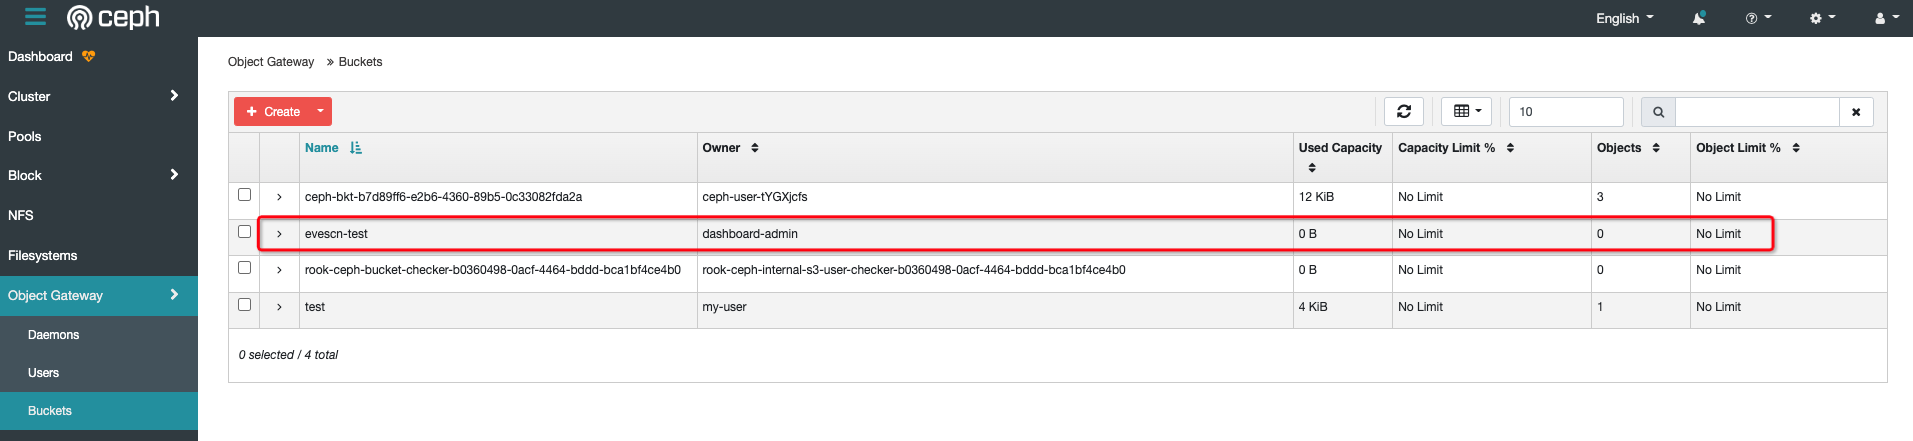
[root@m1 ceph]# radosgw-admin bucket list
[
    "evescn-test",
    "rook-ceph-bucket-checker-b0360498-0acf-4464-bddd-bca1bf4ce4b0",
    "ceph-bkt-b7d89ff6-e2b6-4360-89b5-0c33082fda2a",
    "test"
]
Dashbaord 暴露方式
除了 NodePort 类型之外, kubernetes 提供了另外两种方式将 kubernetes 的 service 暴露给外部访问, kubernetes 提供了三种将内部 service 暴露给外部访问的方式:
NodePort: 自建环境,每个节点协商一个NodePort端口LoadBalancer: 适用于公有云环境下,自动申请一个负载均衡Ingress: 通过七层的方式暴露,需要提前预先安装一个ingress controller
[root@m1 ceph]# ls | grep dashboard
dashboard-external-https.yaml
dashboard-external-http.yaml
dashboard-ingress-https.yaml
dashboard-loadbalancer.yaml
NodePort暴露方式,kubernetes自带功能,使用方便
[root@m1 ceph]# cat dashboard-external-http.yaml
apiVersion: v1
kind: Service
metadata:
  name: rook-ceph-mgr-dashboard-external-http
  namespace: rook-ceph # namespace:cluster
  labels:
    app: rook-ceph-mgr
    rook_cluster: rook-ceph # namespace:cluster
spec:
  ports:
  - name: dashboard
    port: 7000
    protocol: TCP
    targetPort: 7000
  selector:
    app: rook-ceph-mgr
    rook_cluster: rook-ceph
  sessionAffinity: None
  type: NodePort
LoadBalancer暴露方式,需要依赖于云厂商的实现,如果在云环境下可以使用如下的方式暴露,会自动申请一个负载均衡,并将rs指向每个节点的NodePort
[root@m1 ceph]# cat dashboard-loadbalancer.yaml
apiVersion: v1
kind: Service
metadata:
  name: rook-ceph-mgr-dashboard-loadbalancer
  namespace: rook-ceph # namespace:cluster
  labels:
    app: rook-ceph-mgr
    rook_cluster: rook-ceph # namespace:cluster
spec:
  ports:
  - name: dashboard
    port: 8443
    protocol: TCP
    targetPort: 8443
  selector:
    app: rook-ceph-mgr
    rook_cluster: rook-ceph
  sessionAffinity: None
  type: LoadBalancer
ingress暴露方式,七层的服务暴露,需要有一个ingress的控制器,如nginx ingress controller
[root@m1 ceph]# cat dashboard-ingress-https.yaml
#
# This example is for Kubernetes running an ngnix-ingress
# and an ACME (e.g. Let's Encrypt) certificate service
#
# The nginx-ingress annotations support the dashboard
# running using HTTPS with a self-signed certificate
#
apiVersion: extensions/v1beta1
kind: Ingress
metadata:
  name: rook-ceph-mgr-dashboard
  namespace: rook-ceph # namespace:cluster
  annotations:
    kubernetes.io/ingress.class: "nginx"
    kubernetes.io/tls-acme: "true"
    nginx.ingress.kubernetes.io/backend-protocol: "HTTPS"
    nginx.ingress.kubernetes.io/server-snippet: |
      proxy_ssl_verify off;
spec:
  tls:
   - hosts:
     - rook-ceph.example.com
     secretName: rook-ceph.example.com
  rules:
  - host: rook-ceph.example.com
    http:
      paths:
      - path: /
        backend:
          serviceName: rook-ceph-mgr-dashboard
          servicePort: https-dashboard

 浙公网安备 33010602011771号