13 Ceph 管理与监控
Ceph mgr 组件描述
-
ceph mgr 做为 ceph 12.x 版本之后才开始提供,是负责 ceph 集群管理的组件。
-
Ceph Manager守护进程(ceph-mgr)负责跟踪运行时指标和Ceph集群的当前状态,包括存储利用率,当前性能指标和系统负载。
-
Ceph Manager守护进程还基于python的插件来管理和公开Ceph集群信息,包括基于Web的Ceph Manager Dashboard和 REST API。
-
可以配置多个,默认高可用:一个active,其他standby
mgr 特性和功能
mgr 特性
The dashboard provides the following features:
- Multi-User and Role Management: The dashboard supports multiple user
accounts with different permissions (roles). The user accounts and roles
can be modified on both the command line and via the WebUI.
See User and Role Management for details. - Single Sign-On (SSO): the dashboard supports authentication
via an external identity provider using the SAML 2.0 protocol. See
Enabling Single Sign-On (SSO) for details. - SSL/TLS support: All HTTP communication between the web browser and the
dashboard is secured via SSL. A self-signed certificate can be created with
a built-in command, but it’s also possible to import custom certificates
signed and issued by a CA. See SSL/TLS Support for details. - Auditing: the dashboard backend can be configured to log all PUT, POST
and DELETE API requests in the Ceph audit log. See Auditing API Requests
for instructions on how to enable this feature. - Internationalization (I18N): the dashboard can be used in different
languages that can be selected at run-time.
mgr 功能
Currently, Ceph Dashboard is capable of monitoring and managing the following
aspects of your Ceph cluster:
- Overall cluster health: Display overall cluster status, performance
and capacity metrics. - Embedded Grafana Dashboards: Ceph Dashboard is capable of embedding
Grafana dashboards in many locations, to display additional information
and performance metrics gathered by the Prometheus Module. See
Enabling the Embedding of Grafana Dashboards for details on how to configure this functionality. - Cluster logs: Display the latest updates to the cluster’s event and
audit log files. Log entries can be filtered by priority, date or keyword. - Hosts: Display a list of all hosts associated to the cluster, which
services are running and which version of Ceph is installed. - Performance counters: Display detailed service-specific statistics for
each running service. - Monitors: List all MONs, their quorum status, open sessions.
- Monitoring: Enables creation, re-creation, editing and expiration of
Prometheus’ Silences, lists the alerting configuration of Prometheus and
currently firing alerts. Also shows notifications for firing alerts. Needs
configuration. - Configuration Editor: Display all available configuration options,
their description, type and default values and edit the current values. - Pools: List all Ceph pools and their details (e.g. applications,
placement groups, replication size, EC profile, CRUSH ruleset, etc.) - OSDs: List all OSDs, their status and usage statistics as well as
detailed information like attributes (OSD map), metadata, performance
counters and usage histograms for read/write operations. Mark OSDs
up/down/out, purge and reweight OSDs, perform scrub operations, modify
various scrub-related configuration options, select different profiles to
adjust the level of backfilling activity. - iSCSI: List all hosts that run the TCMU runner service, display all
images and their performance characteristics (read/write ops, traffic).
Create, modify and delete iSCSI targets (viaceph-iscsi). See
Enabling iSCSI Management for instructions on how to configure this
feature. - RBD: List all RBD images and their properties (size, objects, features).
Create, copy, modify and delete RBD images. Define various I/O or bandwidth
limitation settings on a global, per-pool or per-image level. Create, delete
and rollback snapshots of selected images, protect/unprotect these snapshots
against modification. Copy or clone snapshots, flatten cloned images. - RBD mirroring: Enable and configure RBD mirroring to a remote Ceph server.
Lists all active sync daemons and their status, pools and RBD images including
their synchronization state. - CephFS: List all active filesystem clients and associated pools,
including their usage statistics. - Object Gateway: List all active object gateways and their performance
counters. Display and manage (add/edit/delete) object gateway users and their
details (e.g. quotas) as well as the users’ buckets and their details (e.g.
owner, quotas). See Enabling the Object Gateway Management Frontend for configuration
instructions. - NFS: Manage NFS exports of CephFS filesystems and RGW S3 buckets via NFS
Ganesha. See NFS-Ganesha Management for details on how to
enable this functionality. - Ceph Manager Modules: Enable and disable all Ceph Manager modules, change
the module-specific configuration settings.
Ceph Dashboard 部署
安装 Ceph Dashboard 包
[root@node0 csi]# yum install --nogpgcheck ceph-mgr-dashboard
启用 Dashboard
[root@node0 csi]# ceph mgr module enable dashboard
Error ENOENT: all mgr daemons do not support module 'dashboard', pass --force to force enablement

[root@node0 csi]# ceph -h | grep modu
......
mgr module ls
......

# 查看启用的模块
[root@node0 csi]# ceph mgr module ls | grep enable -A 5
    "enabled_modules": [
        "iostat",
        "restful"
    ],


[root@node0 csi]# ceph mgr module enable dashboard --force

# 再次查看启用的模块
[root@node0 csi]# ceph mgr module ls | grep enable -A 5
    "enabled_modules": [
        "iostat",
        "restful"
    ],
生成ceph默认证书,不使用 自签证书
[root@node0 csi]# ceph dashboard create-self-signed-cert
Self-signed certificate created
设置 IP 端口等信息
[root@node0 csi]# ceph config set mgr mgr/dashboard/server_addr 182.168.100.130

[root@node0 csi]# ceph config set mgr mgr/dashboard/server_port 8080
ceph config set mgr mgr/dashboard/ssl_server_port 8443

[root@node0 csi]# ceph config set mgr mgr/dashboard/ssl_server_port 8443
查看 Dashboard 信息
[root@node0 csi]# ceph mgr services
{
    "dashboard": "https://node0:8443/"
}
启用用户并设置权限
[root@node0 csi]# cat password.txt
cephpassword

[root@node0 csi]# ceph dashboard ac-user-create cephadmin -i password.txt administrator
{"username": "cephadmin", "lastUpdate": 1667901632, "name": null, "roles": ["administrator"], "password": "$2b$12$bsStG6DQdqulVM0TspdsZehDCH1lOFRM8m20jkP1wCP5W96YPka5y", "email": null}
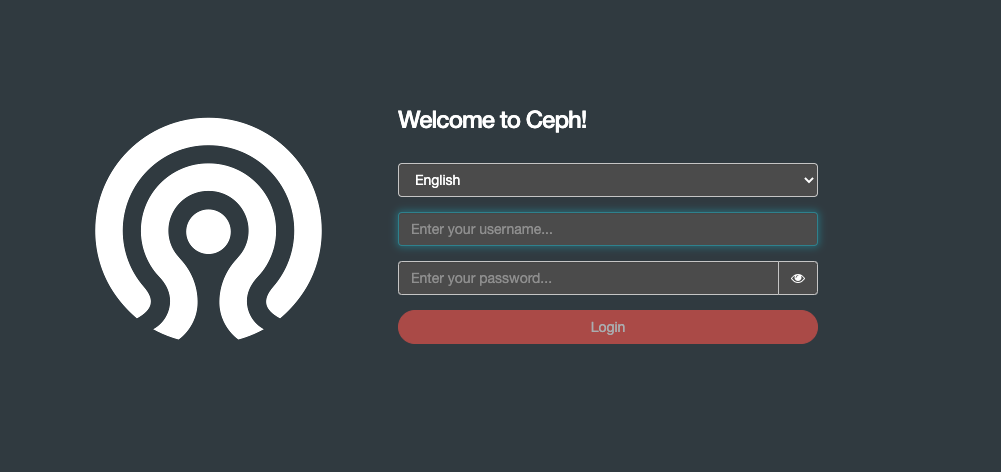
访问 Dashboard
- 查看网站证书
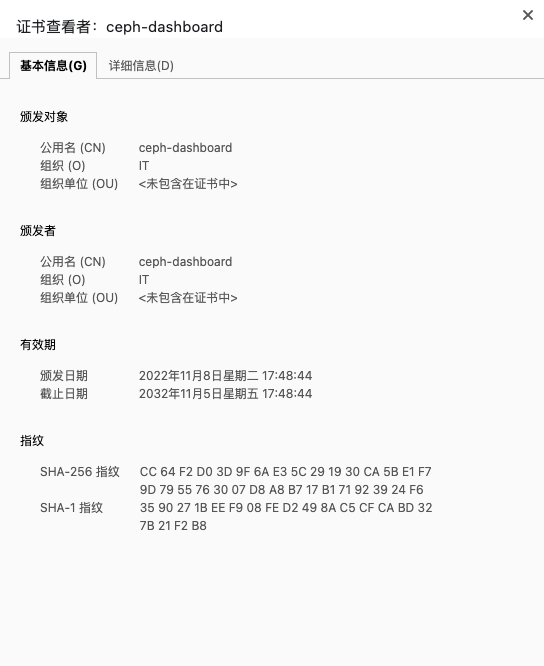
- 登陆 Dashboard
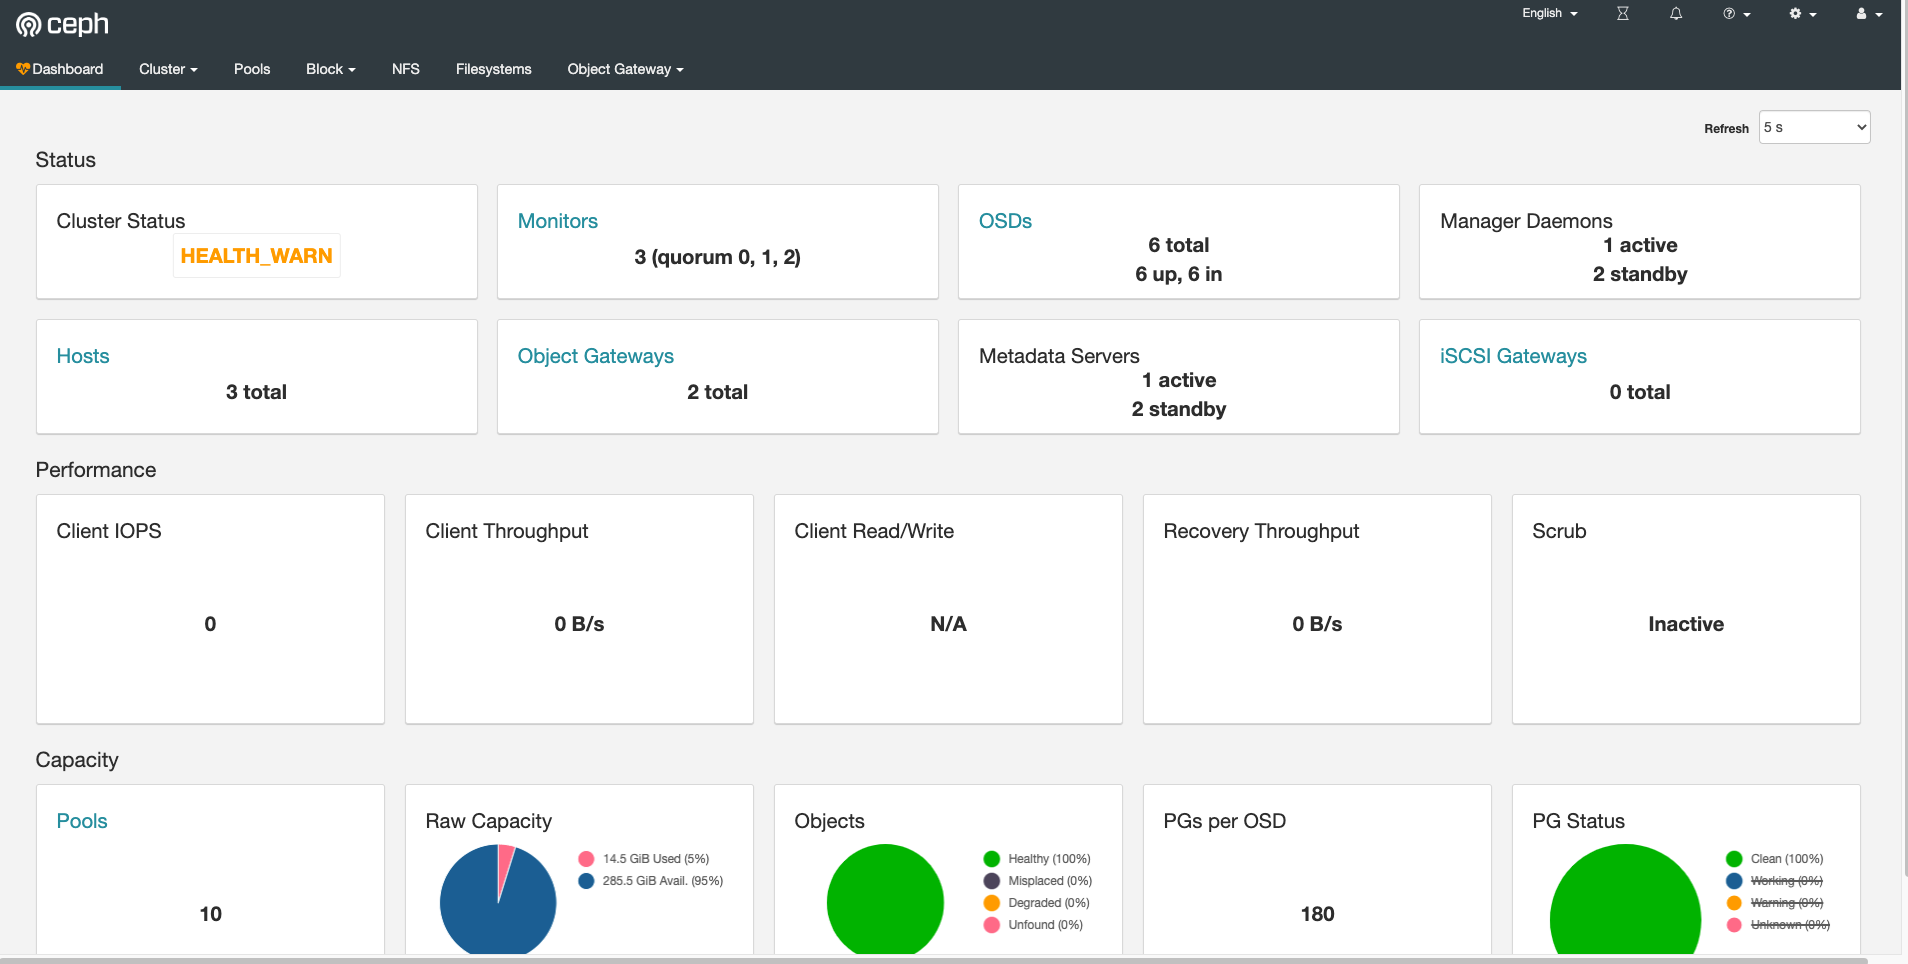
Dashboard 功能使用
登陆 Dashboard 查看各页面和组件即可
manager 插件的使用
manager 插件
- Writing modules
- Writing orchestrator plugins
- Dashboard module
- Alerts module
- DiskPrediction module
- Local pool module
- RESTful module
- Zabbix module
- Prometheus module
- Influx module
- Hello module
- Telegraf module
- Telemetry module
- Iostat module
- Crash module
- Orchestrator CLI module
- Rook module
- DeepSea module
- Insights module
- Ansible module
- SSH orchestrator
Alerts module
The alerts module can send simple alert messages about cluster health
via e-mail. In the future, it will support other notification methods
as well.
Enabling
The alerts module is enabled with:
ceph mgr module enable alerts
Configuration
To configure SMTP, all of the following config options must be set:
ceph config set mgr mgr/alerts/smtp\_host \*<smtp-server>\*
ceph config set mgr mgr/alerts/smtp\_destination \*<email-address-to-send-to>\*
ceph config set mgr mgr/alerts/smtp\_sender \*<from-email-address>\*
By default, the module will use SSL and port 465. To change that,:
ceph config set mgr mgr/alerts/smtp\_ssl false   # if not SSL
ceph config set mgr mgr/alerts/smtp\_port \*<port-number>\*  # if not 465
To authenticate to the SMTP server, you must set the user and password:
ceph config set mgr mgr/alerts/smtp\_user \*<username>\*
ceph config set mgr mgr/alerts/smtp\_password \*<password>\*
By default, the name in the From: line is simply Ceph. To
change that (e.g., to identify which cluster this is),:
ceph config set mgr mgr/alerts/smtp\_from\_name 'Ceph Cluster Foo'
By default, the module will check the cluster health once per minute
and, if there is a change, send a message. To change that
frequency,:
ceph config set mgr mgr/alerts/interval \*<interval>\* # e.g., "5m" for 5 minutes
Commands
To force an alert to be send immediately,:
ceph alerts send
Zabbix Module
The Zabbix module actively sends information to a Zabbix server like:
- Ceph status
- I/O operations
- I/O bandwidth
- OSD status
- Storage utilization
Requirements
The module requires that the zabbix_sender executable is present on all machines running ceph-mgr. It can be installed on most distributions using the package manager.
Dependencies
Installing zabbix_sender can be done under Ubuntu or CentOS using either apt or dnf.
On Ubuntu Xenial:
apt install zabbix-agent
On Fedora:
dnf install zabbix-sender
Enabling
You can enable the zabbix module with:
ceph mgr module enable zabbix
Configuration
Two configuration keys are vital for the module to work:
- zabbix_host
- identifier (optional)
The parameter zabbix_host controls the hostname of the Zabbix server to which zabbix_sender will send the items. This can be a IP-Address if required by your installation.
The identifier parameter controls the identifier/hostname to use as source when sending items to Zabbix. This should match the name of the Host in your Zabbix server.
When the identifier parameter is not configured the ceph-
will be used when sending data to Zabbix.
This would for example be ceph-c4d32a99-9e80-490f-bd3a-1d22d8a7d354
Additional configuration keys which can be configured and their default values:
- zabbix_port: 10051
- zabbix_sender: /usr/bin/zabbix_sender
- interval: 60
Configuration keys
Configuration keys can be set on any machine with the proper cephx credentials,
these are usually Monitors where the client.admin key is present.
ceph zabbix config-set <key> <value>
For example:
ceph zabbix config-set zabbix\_host zabbix.localdomain
ceph zabbix config-set identifier ceph.eu-ams02.local
The current configuration of the module can also be shown:
ceph zabbix config-show

[root@node0 ceph-deploy]# ceph zabbix config-show
{"zabbix_port": 10051, "zabbix_host": "None", "identifier": "", "zabbix_sender": "/usr/bin/zabbix_sender", "interval": 60}
Template
A template.
(XML) to be used on the Zabbix server can be found in the source directory of the module.
This template contains all items and a few triggers. You can customize the triggers afterwards to fit your needs.
Multiple Zabbix servers
It is possible to instruct zabbix module to send data to multiple Zabbix servers.
Parameter zabbix_host can be set with multiple hostnames separated by commas.
Hosnames (or IP adderesses) can be followed by colon and port number. If a port
number is not present module will use the port number defined in zabbix_port.
For example:
ceph zabbix config-set zabbix\_host "zabbix1,zabbix2:2222,zabbix3:3333"
Manually sending data
If needed the module can be asked to send data immediately instead of waiting for
the interval.
This can be done with this command:
ceph zabbix send
The module will now send its latest data to the Zabbix server.
Influx Module
The influx module continuously collects and sends time series data to an
influxdb database.
The influx module was introduced in the 13.x Mimic release.
Enabling
To enable the module, use the following command:
ceph mgr module enable influx
If you wish to subsequently disable the module, you can use the equivalent
disable command:
ceph mgr module disable influx
Configuration
ceph config set mgr mgr/influx/<key> <value>
The most important settings are hostname, username and password. For example, a typical configuration might look like this:
ceph config set mgr mgr/influx/hostname influx.mydomain.com
ceph config set mgr mgr/influx/username admin123
ceph config set mgr mgr/influx/password p4ssw0rd
iostat
This module shows the current throughput and IOPS done on the Ceph cluster.
Enabling
To check if the iostat module is enabled, run:
ceph mgr module ls
The module can be enabled with:
ceph mgr module enable iostat
To execute the module, run:
ceph iostat
[root@node0 ceph-deploy]# ceph iostat
+------------+------------+------------+------------+------------+------------+
|       Read |      Write |      Total |  Read IOPS | Write IOPS | Total IOPS |
+------------+------------+------------+------------+------------+------------+
|      0 B/s |      0 B/s |      0 B/s |          0 |          0 |          0 |
|      0 B/s |      0 B/s |      0 B/s |          0 |          0 |          0 |
|      0 B/s |      0 B/s |      0 B/s |          0 |          0 |          0 |
|      0 B/s |      0 B/s |      0 B/s |          0 |          0 |          0 |
To change the frequency at which the statistics are printed, use the -p
option:
ceph iostat -p <period in seconds>
For example, use the following command to print the statistics every 5 seconds:
ceph iostat -p 5
Crash Module
The crash module collects information about daemon crashdumps and stores
it in the Ceph cluster for later analysis.
Daemon crashdumps are dumped in /var/lib/ceph/crash by default; this can
be configured with the option ‘crash dir’. Crash directories are named by
time and date and a randomly-generated UUID, and contain a metadata file
‘meta’ and a recent log file, with a “crash_id” that is the same.
This module allows the metadata about those dumps to be persisted in
the monitors’ storage.
Enabling
The crash module is enabled with:
ceph mgr module enable crash
Commands
ceph crash post -i <metafile>
Save a crash dump. The metadata file is a JSON blob stored in the crash
dir as meta. As usual, the ceph command can be invoked with -i -,
and will read from stdin.
ceph rm <crashid>
Remove a specific crash dump.
ceph crash ls
List the timestamp/uuid crashids for all new and archived crash info.
ceph crash ls-new
List the timestamp/uuid crashids for all newcrash info.
ceph crash stat
Show a summary of saved crash info grouped by age.
ceph crash info <crashid>
Show all details of a saved crash.
ceph crash prune <keep>
Remove saved crashes older than ‘keep’ days.
ceph crash archive <crashid>
Archive a crash report so that it is no longer considered for the RECENT\_CRASH health check and does not appear in the crash ls-new output (it will still appear in the crash ls output).
ceph crash archive-all
Archive all new crash reports.
Options
mgr/crash/warn\_recent\_interval[default: 2 weeks] controls what constitutes “recent” for the purposes of raising theRECENT\_CRASHhealth warning.mgr/crash/retain\_interval[default: 1 year] controls how long crash reports are retained by the cluster before they are automatically purged.
Insights Module
The insights module collects and exposes system information to the Insights Core
data analysis framework. It is intended to replace explicit interrogation of
Ceph CLIs and daemon admin sockets, reducing the API surface that Insights
depends on. The insights reports contains the following:
- Health reports. In addition to reporting the current health of the
cluster, the insights module reports a summary of the last 24 hours of health
checks. This feature is important for catching cluster health issues that are
transient and may not be present at the moment the report is generated. Health
checks are deduplicated to avoid unbounded data growth. - Crash reports. A summary of any daemon crashes in the past 24 hours is
included in the insights report. Crashes are reported as the number of crashes
per daemon type (e.g. ceph-osd) within the time window. Full details of a
crash may be obtained using the crash module. - Software version, storage utilization, cluster maps, placement group summary,
monitor status, cluster configuration, and OSD metadata.
Enabling
The insights module is enabled with:
ceph mgr module enable insights
Commands
ceph insights
Generate the full report.
ceph insights prune-health <hours>
Remove historical health data older than
clear all health data.
This command is useful for cleaning the health history before automated nightly
reports are generated, which may contain spurious health checks accumulated
while performing system maintenance, or other health checks that have been
resolved. There is no need to prune health data to reclaim storage space;
garbage collection is performed regularly to remove old health data from
persistent storage.
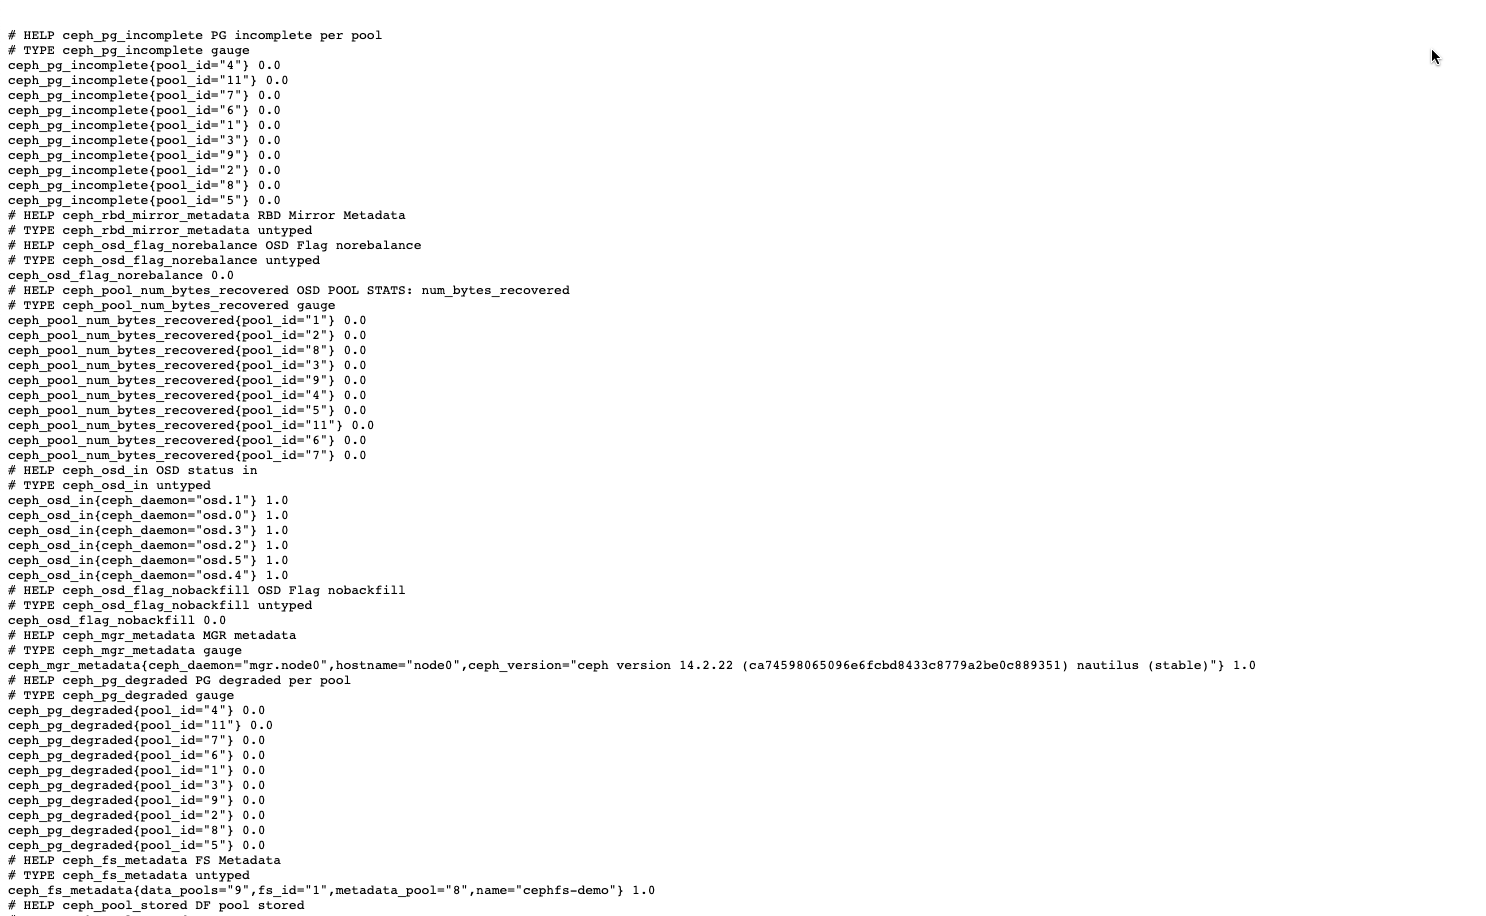
启用 Prometheus 模块
Prometheus Module
Provides a Prometheus exporter to pass on Ceph performance counters
from the collection point in ceph-mgr. Ceph-mgr receives MMgrReport
messages from all MgrClient processes (mons and OSDs, for instance)
with performance counter schema data and actual counter data, and keeps
a circular buffer of the last N samples. This module creates an HTTP
endpoint (like all Prometheus exporters) and retrieves the latest sample
of every counter when polled (or “scraped” in Prometheus terminology).
The HTTP path and query parameters are ignored; all extant counters
for all reporting entities are returned in text exposition format.
(See the Prometheus documentation.)
Enabling prometheus output
The prometheus module is enabled with:
ceph mgr module enable prometheus
Configuration
Note
The Prometheus manager module needs to be restarted for configuration changes to be applied.
By default the module will accept HTTP requests on port 9283 on all IPv4
and IPv6 addresses on the host. The port and listen address are both
configurable with ceph config-key set, with keys
mgr/prometheus/server\_addr and mgr/prometheus/server\_port. This port
is registered with Prometheus’s registry.
ceph config set mgr mgr/prometheus/server\_addr 0.0.0.0
ceph config set mgr mgr/prometheus/server\_port 9283
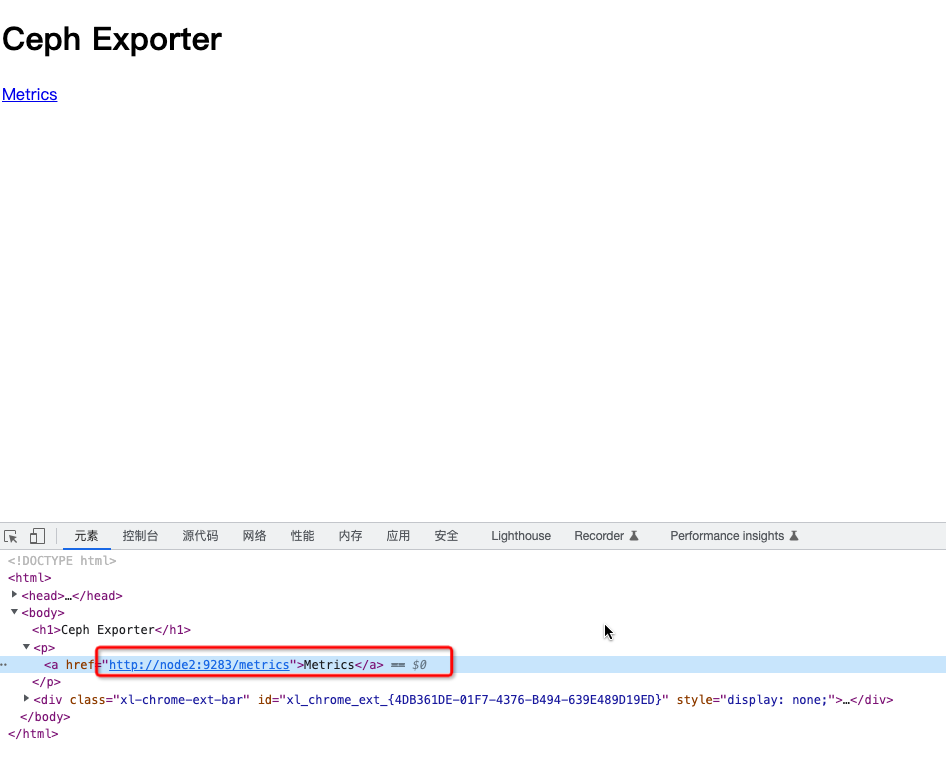
Ceph 集群启用 Prometheus 模块
模块启用后,会监控在当前集群的 mgr 服务的 9283 节点
[root@node0 ceph-deploy]# ceph mgr module enable prometheus
[root@node0 ceph-deploy]# ceph mgr module ls | less
{
    "always_on_modules": [
        "balancer",
        "crash",
        "devicehealth",
        "orchestrator_cli",
        "progress",
        "rbd_support",
        "status",
        "volumes"
    ],
    "enabled_modules": [
        "alerts",
        "dashboard",
        "iostat",
        "prometheus",
        "restful",
        "zabbix"
    ],
查看监控数据
Prometheus 服务端安装
配置 Prometheus yaml 源
[root@node0 ceph-deploy]# cd /etc/yum.repos.d/

[root@node0 yum.repos.d]# cat prometheus.repo
[prometheus]
name=prometheus
baseurl=https://packagecloud.io/prometheus-rpm/release/el/$releasever/$basearch
repo_gpgcheck=1
enabled=1
gpgkey=https://packagecloud.io/prometheus-rpm/release/gpgkey
       https://raw.githubusercontent.com/lest/prometheus-rpm/master/RPM-GPG-KEY-prometheus-rpm
gpgcheck=1
metadata_expire=300
安装软件
[root@node0 yum.repos.d]# yum install -y prometheus
Loaded plugins: fastestmirror
Loading mirror speeds from cached hostfile
 * base: mirrors.aliyun.com
 * extras: mirrors.aliyun.com
 * updates: mirrors.aliyun.com
prometheus/7/x86_64/signature                                                                                                                                       |  833 B  00:00:00
prometheus/7/x86_64/signature                                                                                                                                       | 1.8 kB  00:00:00 !!!
Resolving Dependencies
--> Running transaction check
---> Package prometheus.x86_64 0:1.8.2-1.el7.centos will be installed
--> Finished Dependency Resolution

Dependencies Resolved

===========================================================================================================================================================================================
 Package                                     Arch                                    Version                                             Repository                                   Size
===========================================================================================================================================================================================
Installing:
 prometheus                                  x86_64                                  1.8.2-1.el7.centos                                  prometheus                                   11 M

Transaction Summary
===========================================================================================================================================================================================
Install  1 Package

Total size: 11 M
Installed size: 50 M
Downloading packages:
Running transaction check
Running transaction test
Transaction test succeeded
Running transaction
  Installing : prometheus-1.8.2-1.el7.centos.x86_64                                                                                                                                    1/1
  Verifying  : prometheus-1.8.2-1.el7.centos.x86_64                                                                                                                                    1/1

Installed:
  prometheus.x86_64 0:1.8.2-1.el7.centos

Complete!
服务配置
prometheus.yml
global:
  scrape\_interval:     15s
  evaluation\_interval: 15s

scrape\_configs:
  - job\_name: 'node'
    file\_sd\_configs:
      - files:
        - node\_targets.yml
  - job\_name: 'ceph'
    honor\_labels: true
    file\_sd\_configs:
      - files:
        - ceph\_targets.yml
ceph_targets.yml
[
    {
        "targets": [ "senta04.mydomain.com:9283" ],
        "labels": {}
    }
]
node_targets.yml
[
    {
        "targets": [ "senta04.mydomain.com:9100" ],
        "labels": {
            "instance": "senta04"
        }
    }
]
Prometheus 配置
修改 Prometheus 配置文件
[root@node0 yum.repos.d]# cd /etc/prometheus/

[root@node0 prometheus]# ls
prometheus.yml
[root@node0 prometheus]# cp prometheus.yml prometheus.yml.bak

[root@node0 prometheus]# vim prometheus.yml
# my global config
global:
  scrape_interval:     15s # Set the scrape interval to every 15 seconds. Default is every 1 minute.
  evaluation_interval: 15s # Evaluate rules every 15 seconds. The default is every 1 minute.
  # scrape_timeout is set to the global default (10s).

  # Attach these labels to any time series or alerts when communicating with
  # external systems (federation, remote storage, Alertmanager).
  #external_labels:
  #    monitor: 'codelab-monitor'

# Load rules once and periodically evaluate them according to the global 'evaluation_interval'.
#rule_files:
  # - "first.rules"
  # - "second.rules"

# A scrape configuration containing exactly one endpoint to scrape:
# Here it's Prometheus itself.
scrape_configs:
  # The job name is added as a label `job=<job_name>` to any timeseries scraped from this config.
  - job_name: 'prometheus'

    # metrics_path defaults to '/metrics'
    # scheme defaults to 'http'.

    static_configs:
      - targets: ['localhost:9090']

  - job_name: 'ceph-exporter'
    honor_labels: true
    static_configs:
    # 当前 mgr 在 node0 上,所以此处配置此 IP 地址
    - targets: ['node0:9283']
      labels:
        instance: ceph-exporter
- 查看 ceph 集群状态
[root@node0 prometheus]# ceph -s
  cluster:
    id:     97702c43-6cc2-4ef8-bdb5-855cfa90a260
    health: HEALTH_ERR
            Module 'dashboard' has failed: error('No socket could be created',)
            No Zabbix server configured
            application not enabled on 1 pool(s)

  services:
    mon: 3 daemons, quorum node0,node1,node2 (age 9d)
    mgr: node0(active, since 18m), standbys: node2, node1   # mgr 在 node0 节点
    mds: cephfs-demo:1 {0=node1=up:active} 2 up:standby
    osd: 6 osds: 6 up (since 9d), 6 in (since 3w)
    rgw: 2 daemons active (node0, node1)

  task status:

  data:
    pools:   10 pools, 360 pgs
    objects: 1.14k objects, 2.7 GiB
    usage:   14 GiB used, 285 GiB / 300 GiB avail
    pgs:     360 active+clean
启动服务
[root@node0 prometheus]# systemctl start prometheus
[root@node0 prometheus]# ss -tnlp | grep prome
LISTEN     0      128       [::]:9090                  [::]:*                   users:(("prometheus",pid=1726607,fd=3))
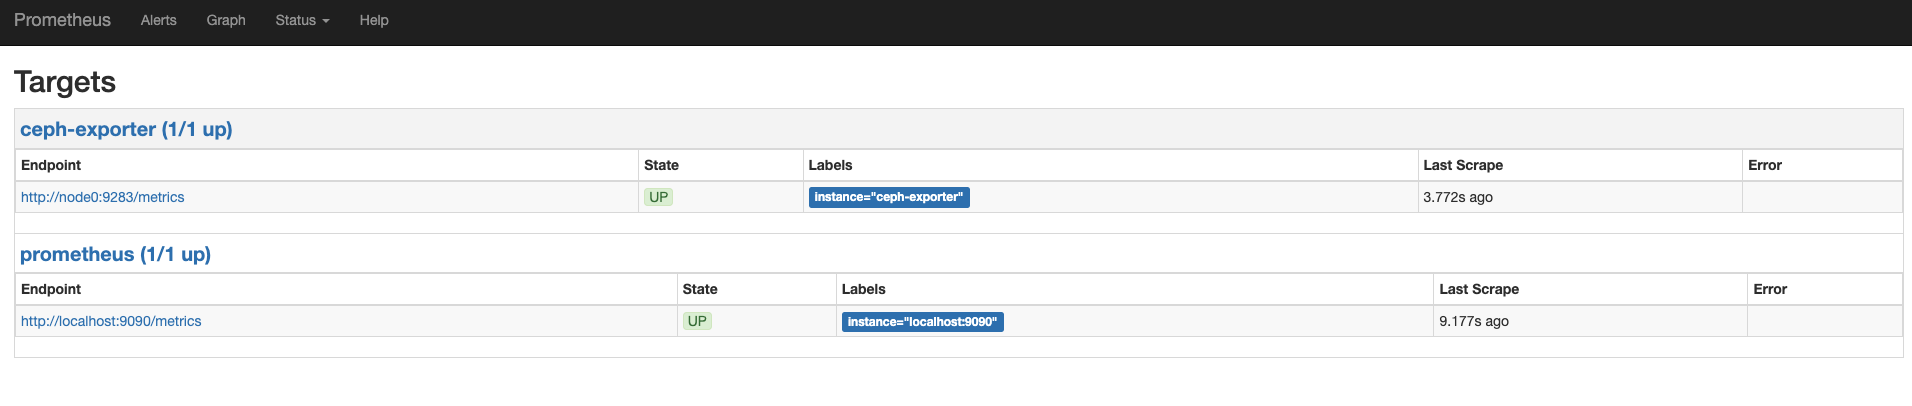
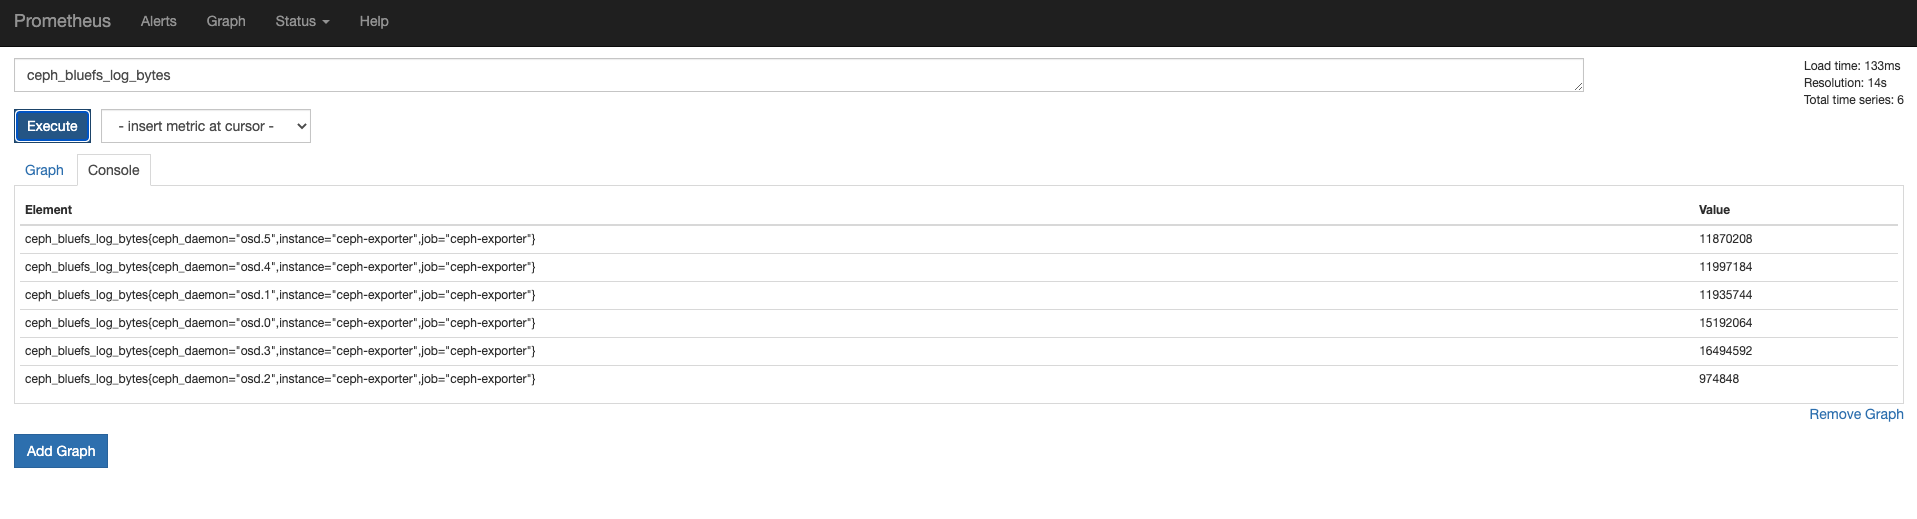
查看 Prometheus
Grafana 配置监控模版
安装 Grafana
[root@node0 prometheus]# yum install https://mirrors.cloud.tencent.com/grafana/yum/rpm/grafana-9.2.3-1.x86_64.rpm
启动服务
[root@node0 ~]# systemctl enable grafana-server --now
Created symlink from /etc/systemd/system/multi-user.target.wants/grafana-server.service to /usr/lib/systemd/system/grafana-server.service.

[root@node0 ~]# ss -tnlp | grep grafana
LISTEN     0      128       [::]:3000                  [::]:*                   users:(("grafana-server",pid=1906441,fd=14))

[root@node0 ~]# systemctl status grafana-server
● grafana-server.service - Grafana instance
   Loaded: loaded (/usr/lib/systemd/system/grafana-server.service; enabled; vendor preset: disabled)
   Active: active (running) since Sat 2022-11-19 18:48:42 CST; 17s ago
     Docs: http://docs.grafana.org
 Main PID: 1906441 (grafana-server)
   CGroup: /system.slice/grafana-server.service
           └─1906441 /usr/sbin/grafana-server --config=/etc/grafana/grafana.ini --pidfile=/...

Nov 19 18:48:42 node0 grafana-server[1906441]: logger=infra.usagestats.collector t=2022-1...=2
Nov 19 18:48:42 node0 grafana-server[1906441]: logger=server t=2022-11-19T18:48:42.222277...41
Nov 19 18:48:42 node0 grafana-server[1906441]: logger=provisioning.alerting t=2022-11-19T...g"
Nov 19 18:48:42 node0 grafana-server[1906441]: logger=provisioning.alerting t=2022-11-19T...g"
Nov 19 18:48:42 node0 systemd[1]: Started Grafana instance.
Nov 19 18:48:42 node0 grafana-server[1906441]: logger=grafanaStorageLogger t=2022-11-19T1...g"
Nov 19 18:48:42 node0 grafana-server[1906441]: logger=http.server t=2022-11-19T18:48:42.2...t=
Nov 19 18:48:42 node0 grafana-server[1906441]: logger=ngalert t=2022-11-19T18:48:42.23439...p"
Nov 19 18:48:42 node0 grafana-server[1906441]: logger=ticker t=2022-11-19T18:48:42.234578...00
Nov 19 18:48:42 node0 grafana-server[1906441]: logger=ngalert.multiorg.alertmanager t=202...r"
Hint: Some lines were ellipsized, use -l to show in full.
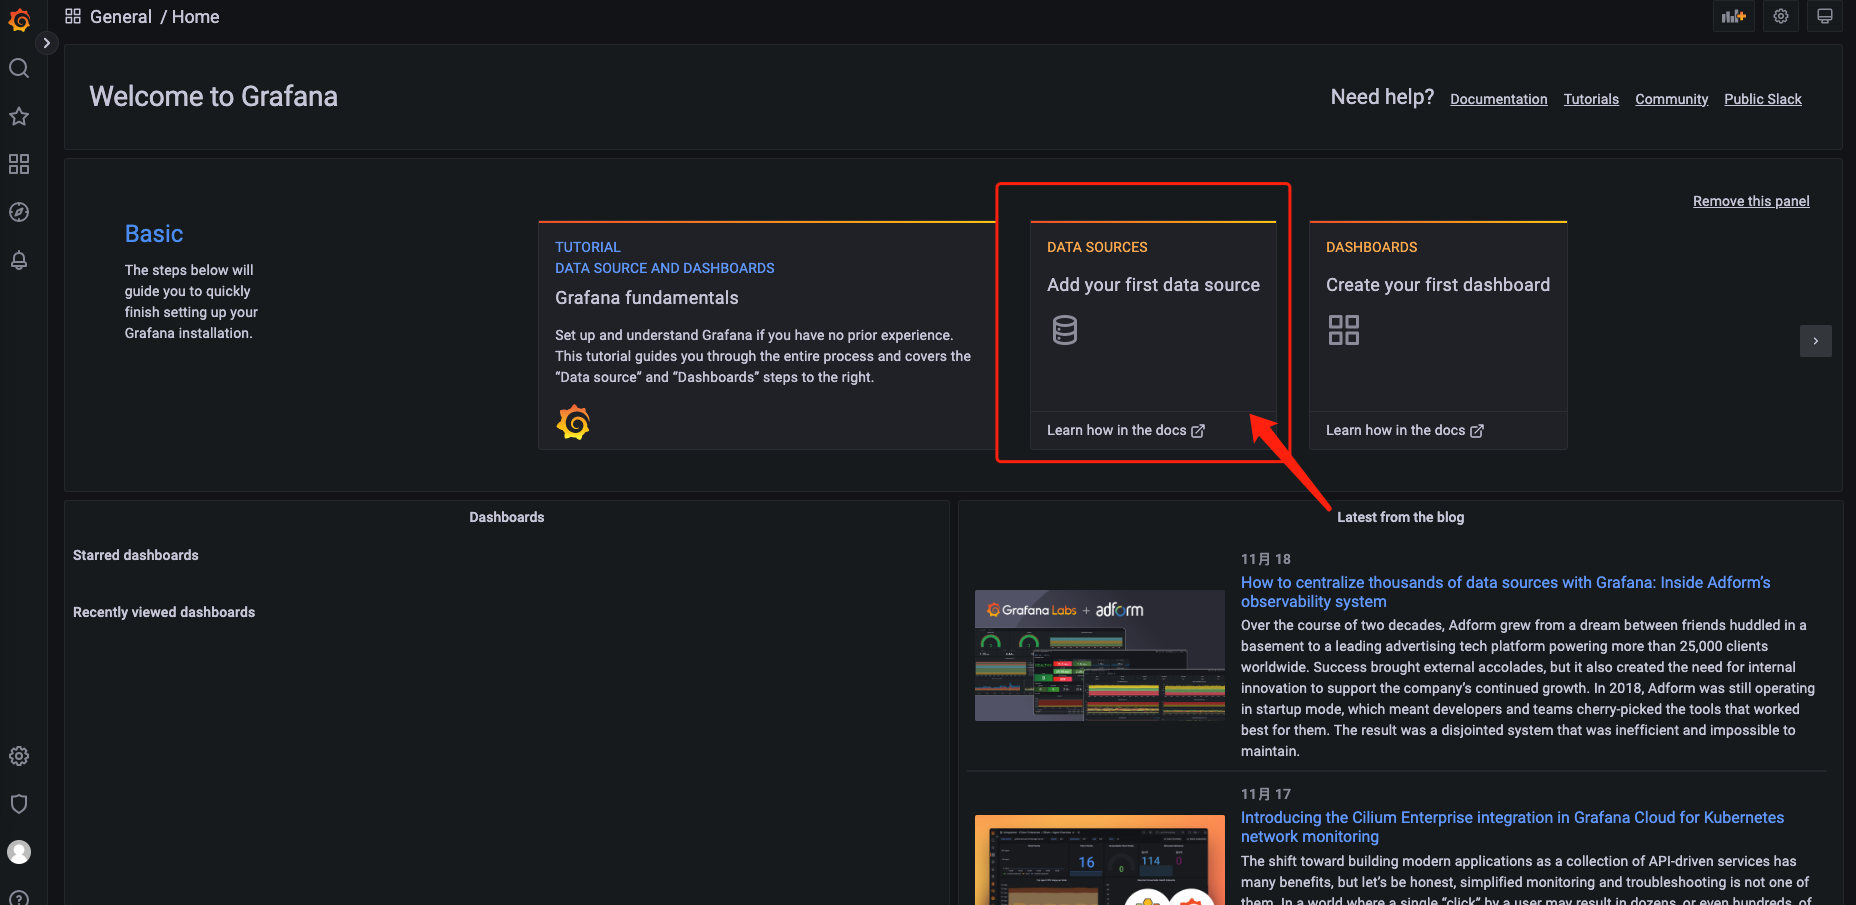
访问 Grafana
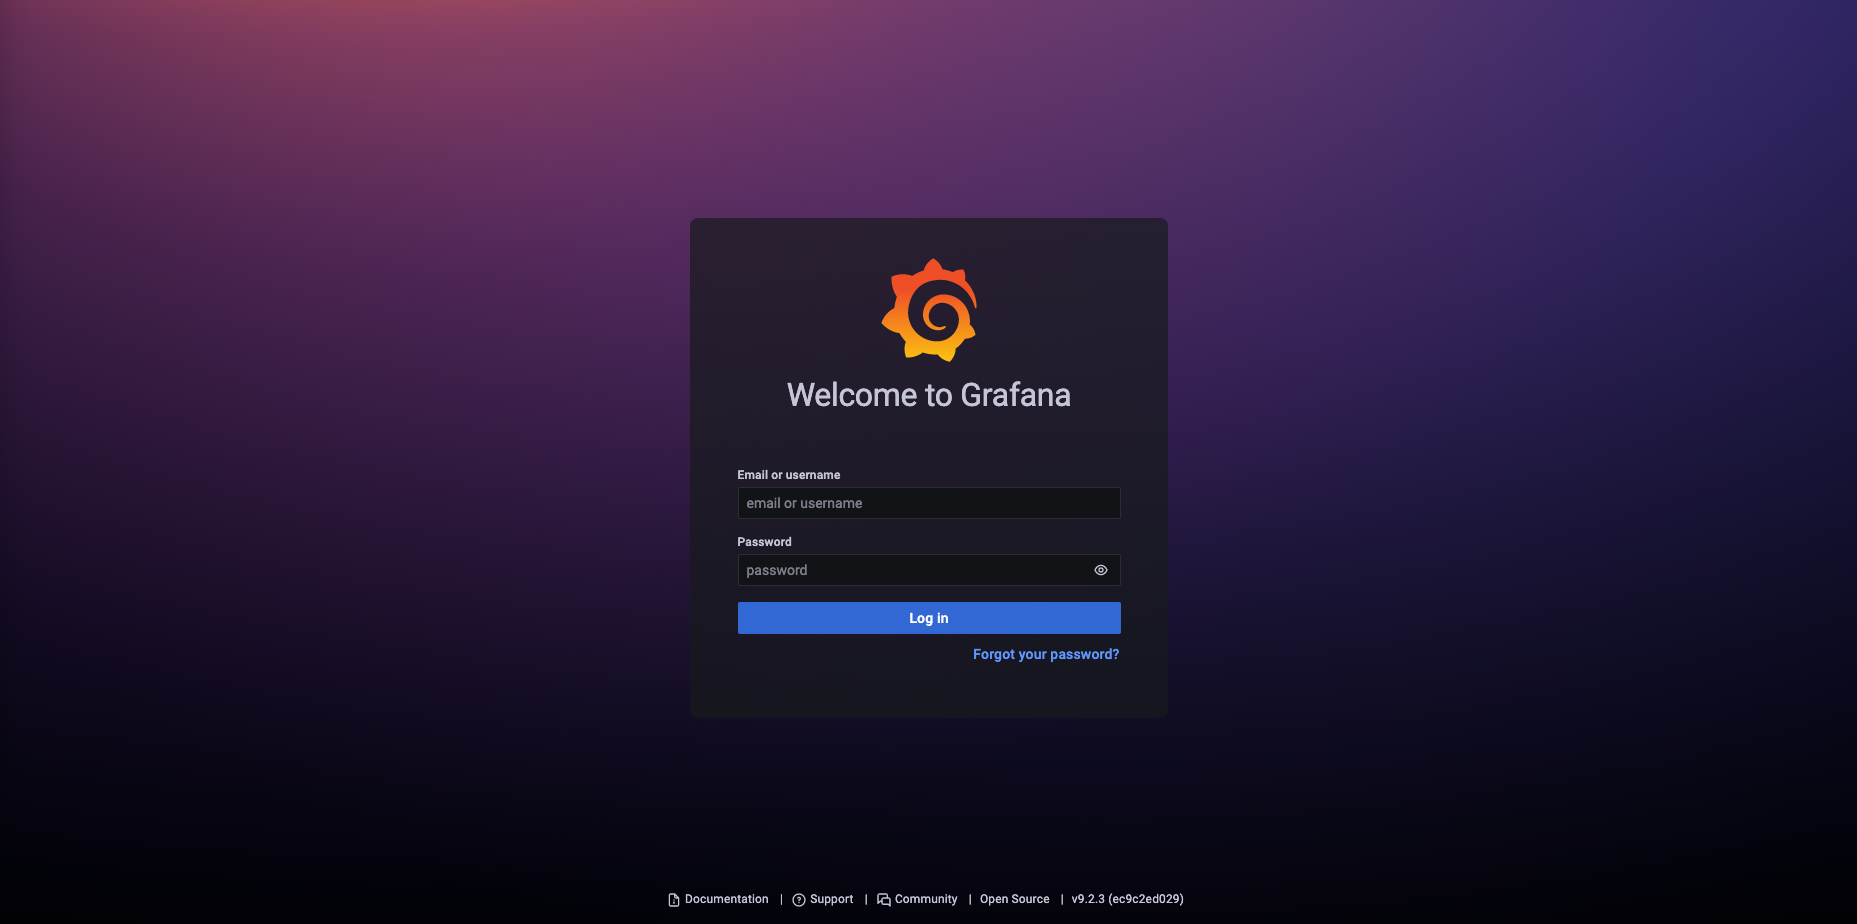
使用 admin/admin 登陆,添加数据源
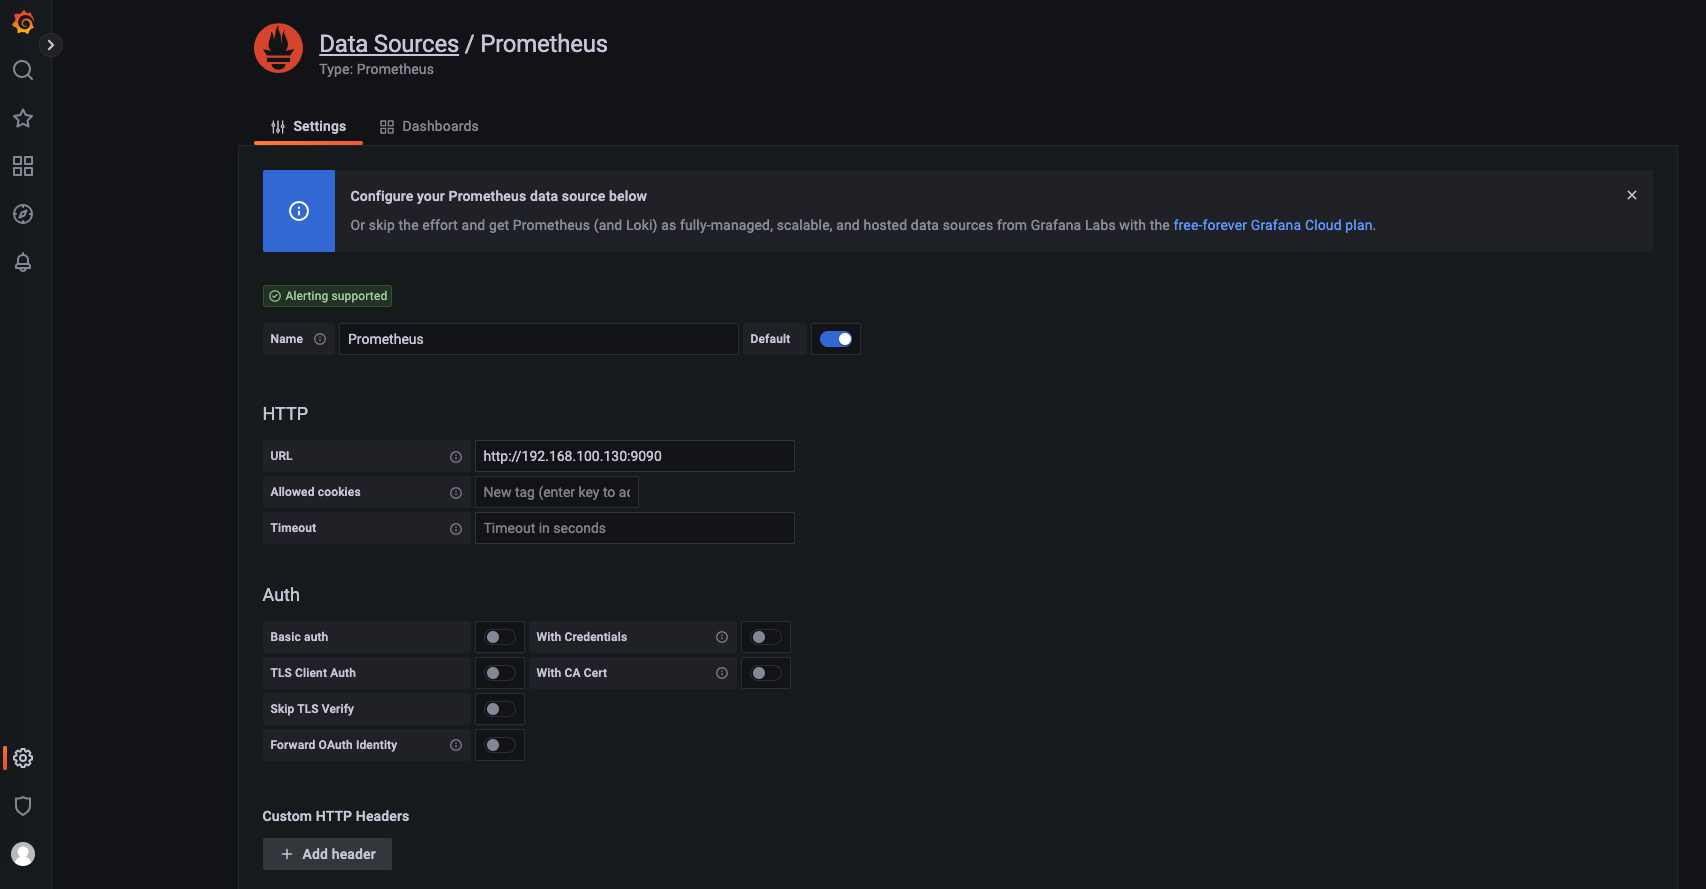
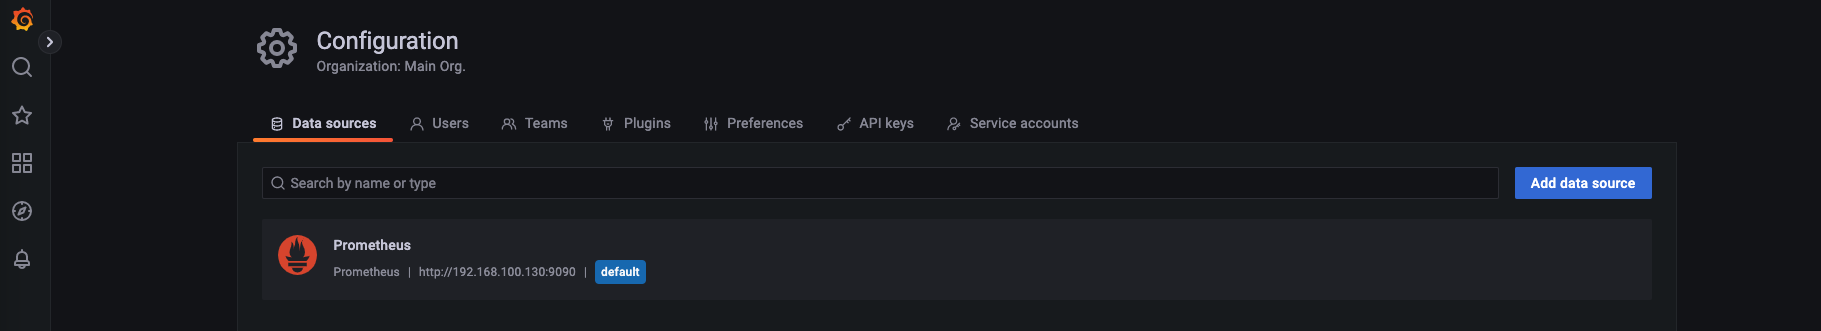
配置 Prometheus 信息
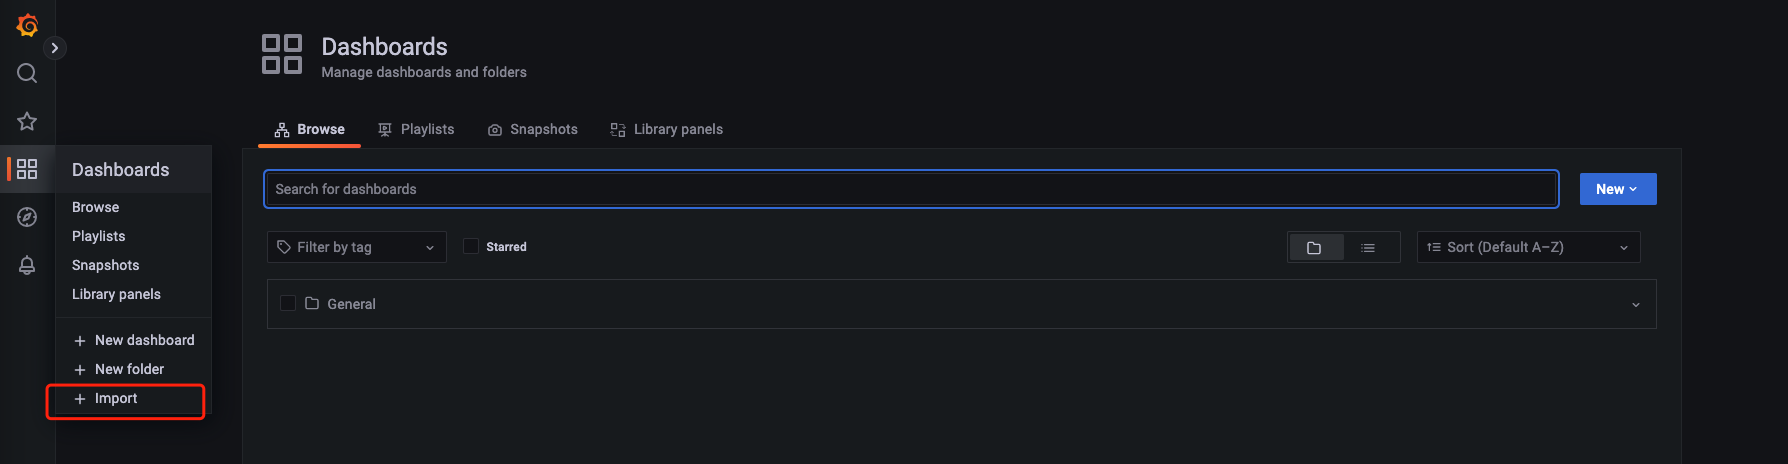
Grafana 功能演示
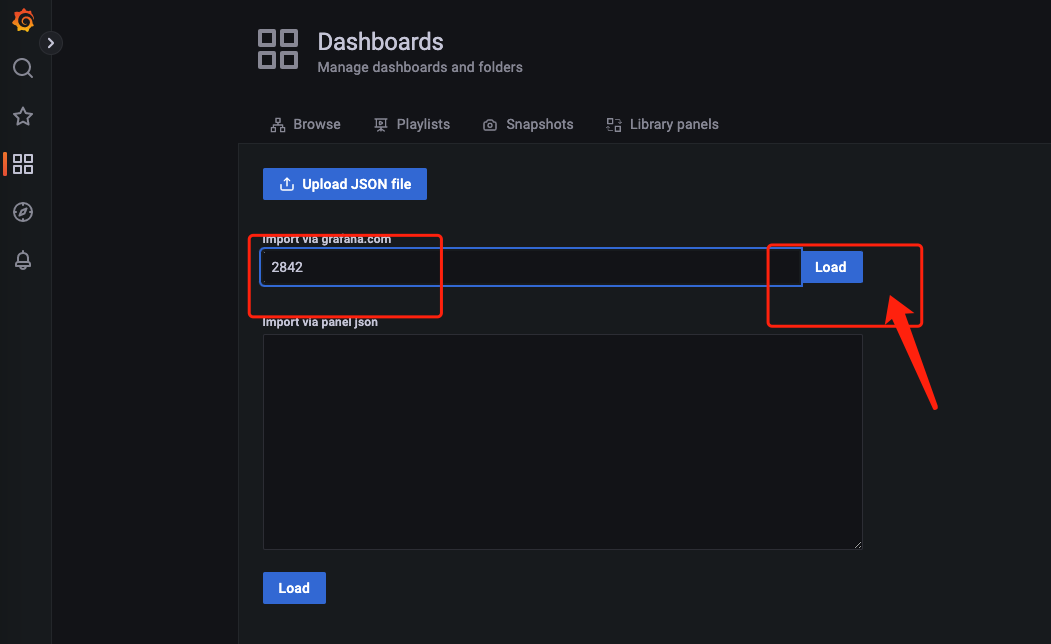
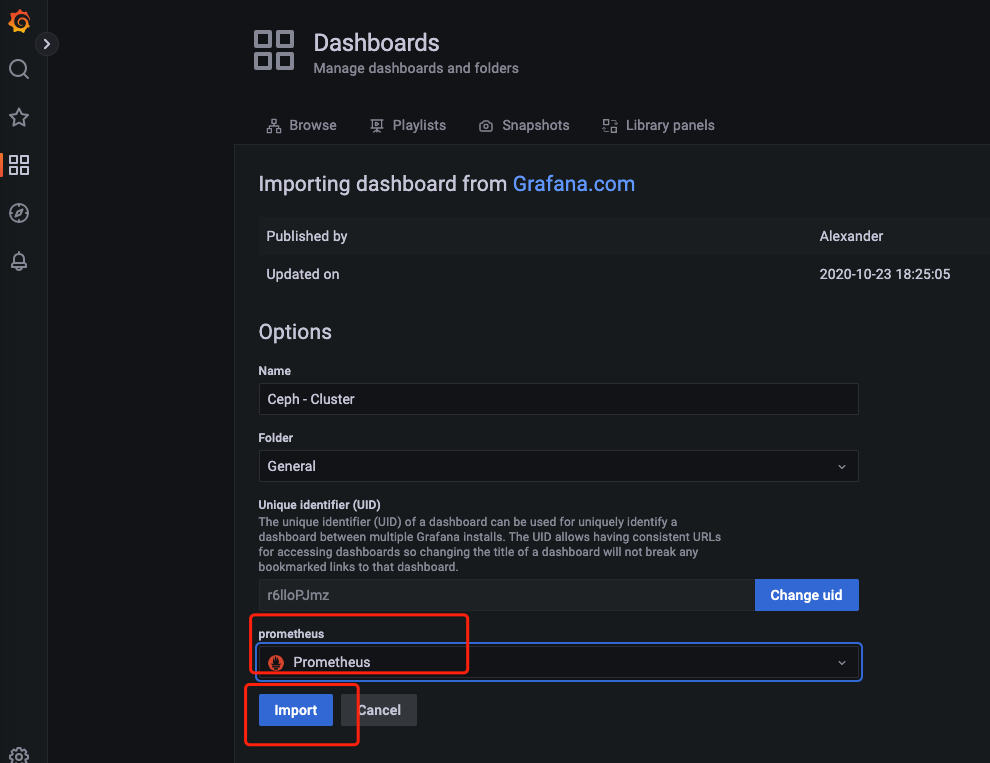
导入模版
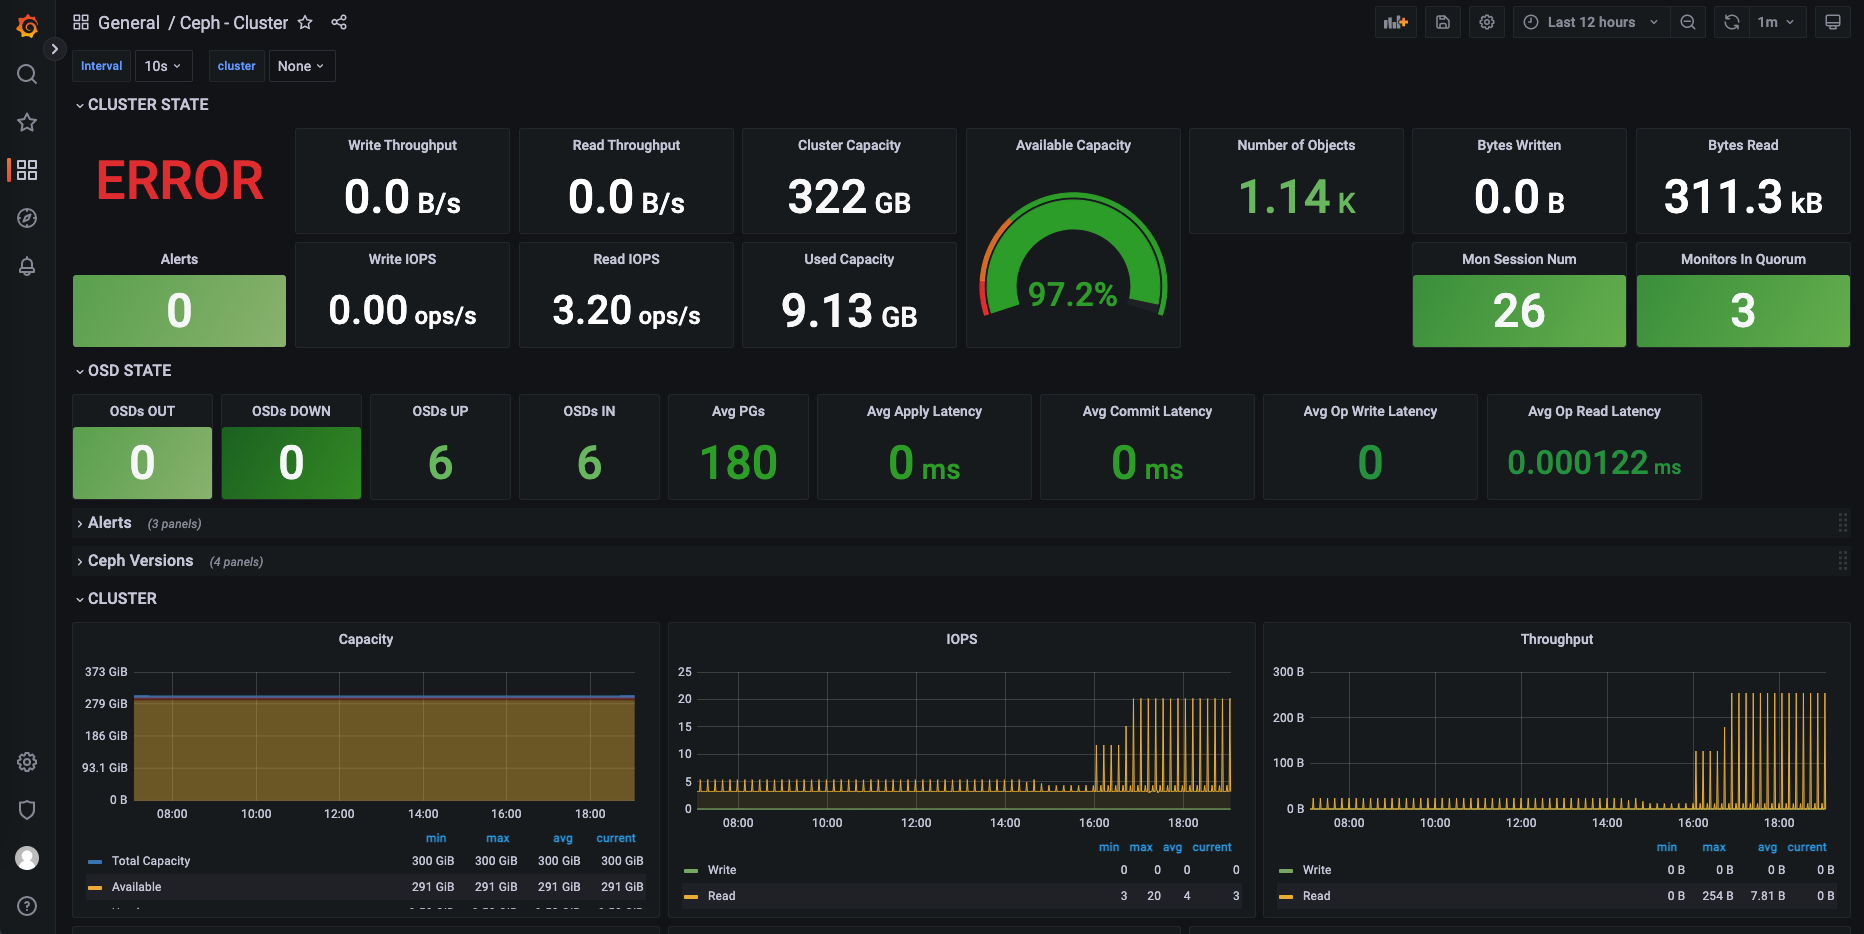
查看数据

 浙公网安备 33010602011771号