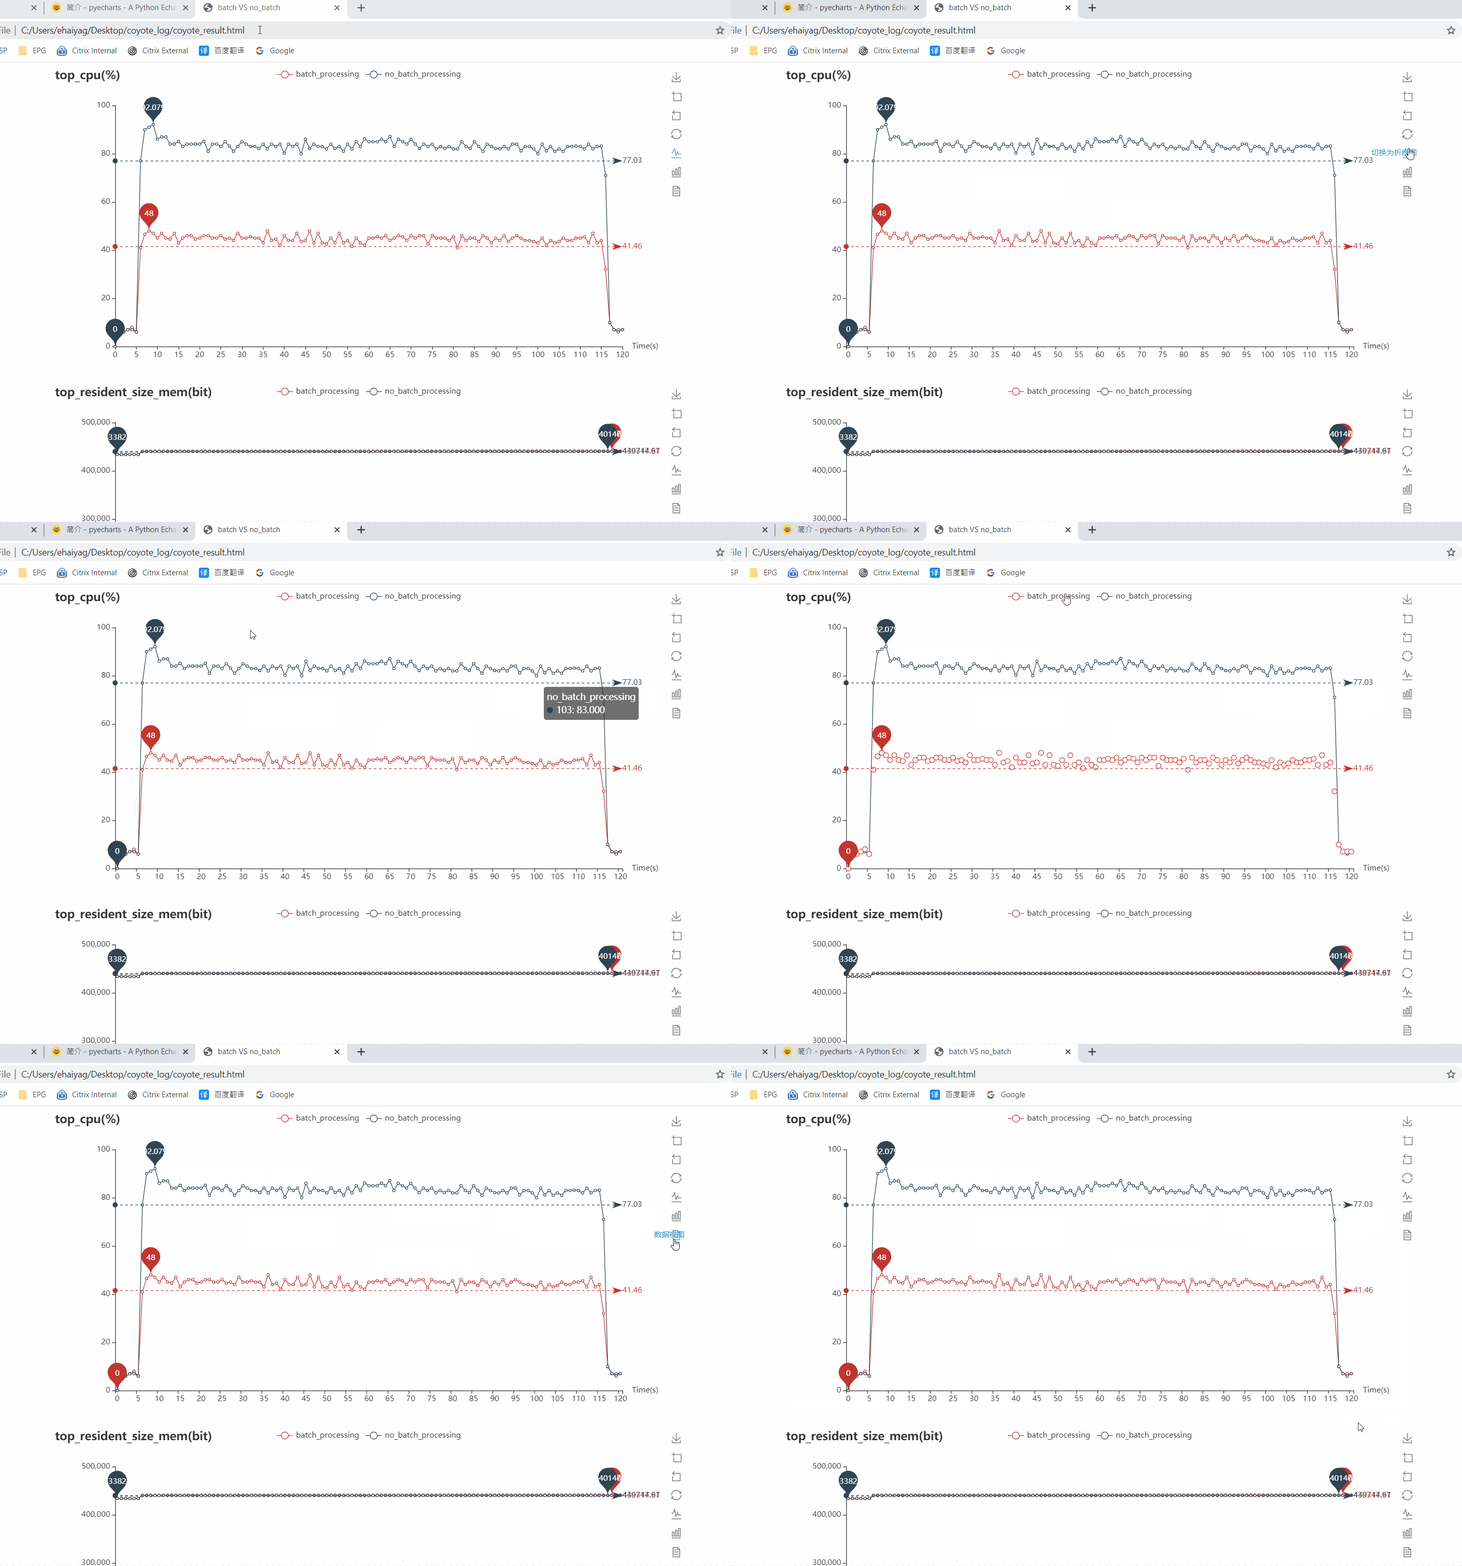
用pyecharts从csv里读取数据并画图
使用方法为
~/script/coyote_result.py -t1 batch_processing -b1 Coyote_2021-06-28_0945_batch/testsuite_performance_cups_proxy_lib/PROXY-Perf.02-C_http_match_enforce_no_dns-100p_IPv4/ -t2 no_batch_processing -b2 Coyote_2021-06-28_0921_noBatch/testsuite_performance_cups_proxy_lib/PROXY-Perf.02-C_http_match_enforce_no_dns-100p_IPv4/ -l .
代码如下:
#!/usr/bin/python3

import csv
from pyecharts.charts import Line, Page, Tab
import pyecharts.options as opts
import argparse

kpi_list = ["top_cpu", "top_resident_size_mem", "top_shr_mem", "top_virtual_mem"]

class load_data_from_csv(object):
    def __init__(self, csv_file, row_number=0):
        self.file = csv_file
        self.index = row_number

    def load(self):
        with open(self.file, 'r', newline='', encoding='utf-8-sig', errors='ignore') as f:
            f_csv = csv.reader(f)
            index_list = list()
            for i, row in enumerate(f_csv):
                if i == self.index:
                    j = 0
                    for v in row:
                        index_list.append(j)
                        j = j + 1
            return index_list, row

def parse_args():
    parse = argparse.ArgumentParser(description="generate the compare graph for coyote test")
    parse.add_argument("-b1", help='coyote test data1', dest='data1', required=True)
    parse.add_argument("-b2", help='coyote test data2', dest='data2', required=False, default=None)
    parse.add_argument("-t1", help='the title for coyote test data1', dest='title1', required=True)
    parse.add_argument("-t2", help='the title for coyote test data2', dest='title2', required=False, default=None)
    parse.add_argument("-l", help='the compare data graph html location', dest='location', required=True)
    return parse.parse_args()


def generate_line(title, series_dic, x_axis):
    if "mem" in title:
        title = title + "(bit)"
    else:
        title = title + "(%)"

    line = Line(init_opts=opts.InitOpts(width="1000px",bg_color='white')).set_global_opts(title_opts=opts.TitleOpts(title=title),toolbox_opts=opts.ToolboxOpts(
            is_show=True,
            orient='vertical',pos_left="right",feature={"saveAsImage": {} ,
                        "dataZoom":{"yAxisIndex": "none"},
                        "restore": {} ,
                        "magicType":{"show": True, "type":["line","bar"]},
                        "dataView": {}}),
            xaxis_opts=opts.AxisOpts(name="Time(s)",name_location="end",name_gap=15))
    line.add_xaxis(xaxis_data=x_axis)

    for k, v in series_dic.items():
        line.add_yaxis(series_name=k, y_axis=v, markpoint_opts=opts.MarkPointOpts(
            data=[
                opts.MarkPointItem(type_="max", name="Maximum"),
                opts.MarkPointItem(type_="min", name="Minimum"),
            ]
        ), markline_opts=opts.MarkLineOpts(data=[opts.MarkLineItem(type_="average", name="Average")]))
    line.set_series_opts(label_opts=opts.LabelOpts(is_show=False))
    return line

def gen_page(indicator="top_cpu"):
    index, indicator_data = load_data_from_csv(args.data1 + indicator + ".csv").load()
    indicator_dic = {args.title1: indicator_data}

    #if the second data exist, add it into dict
    if args.data2 != None:
        index2, indicator_data2 = load_data_from_csv(args.data2 + indicator + ".csv").load()
        indicator_dic[args.title2] = indicator_data2

    return generate_line(indicator, indicator_dic, index)

if __name__ == "__main__":
    args = parse_args()
    page = Page(page_title="batch VS no_batch", layout=Page.SimplePageLayout)
    for kpi in kpi_list:
        page.add(gen_page(kpi))
    page.render(args.location + "/coyote_result.html")
示例html:


 浙公网安备 33010602011771号